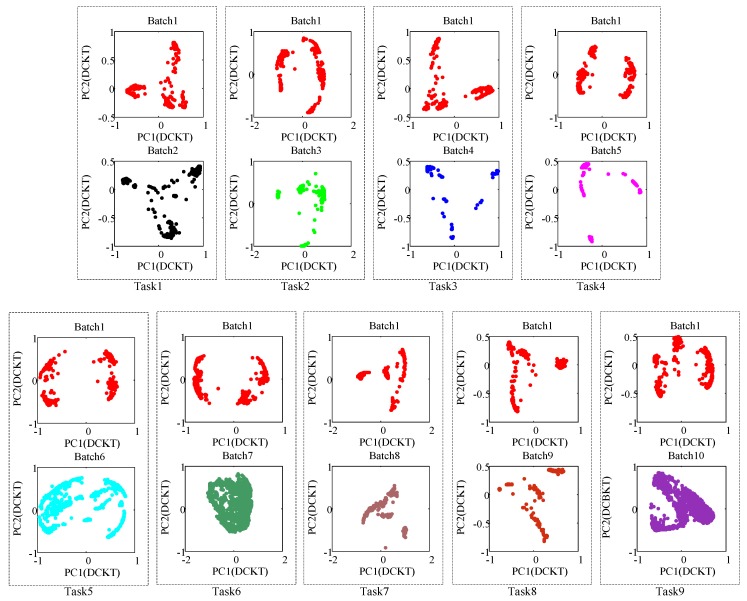
Figure 4.
Principal components (PC1 vs. PC2) of the source domain and the target domain after DCKT (i.e., the 2-D subspace distribution of 9 tasks, respectively). In each task, the top picture is the Batch 1 (source domain) after DCKT and the picture below is the Batch i (target domain) after DCKT, from it we can find that the distribution of source domain and target domain is more similar after DCKT.

