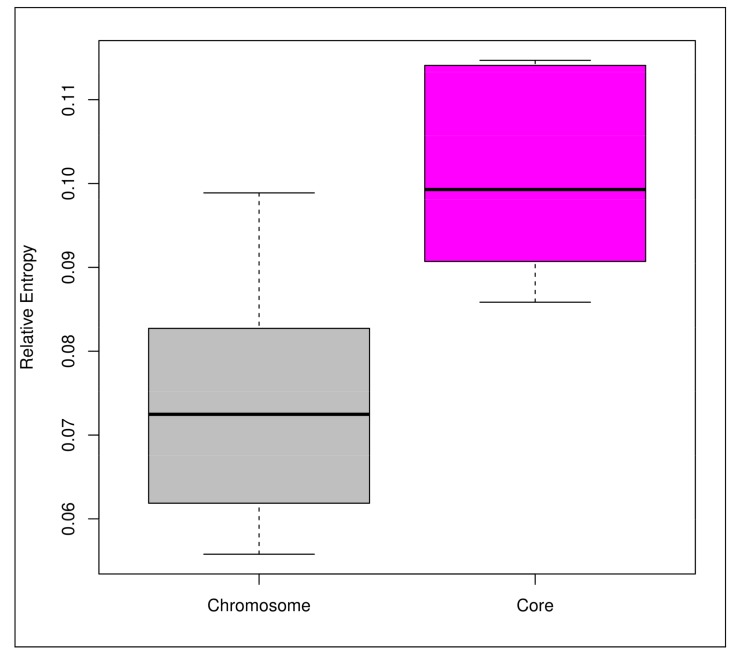
Figure 2.
The relative entropy of chromosome versus core-genome for the 56 PHBifs. The relative entropy depicts the magnitude of the selection pressure. The core part has a higher selection pressure than that of the chromosome. Significant differences between the two groups were tested with the Welch’s t-test (p-value < 0.001).

