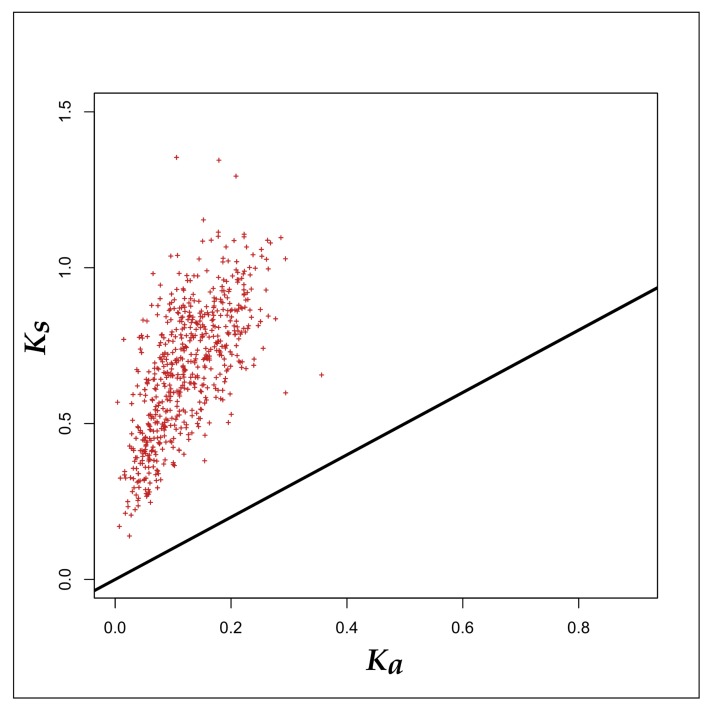
Figure 3.
A plot of Ka versus Ks of the 613 gene groups of the orthologous genes from the 56 PHBifs. Straight line represents Ka = Ks. Each symbol (+) represents a gene group of 56 orthologous nucleotide sequences from the 56 bifidobacterial genomes. The figure implies that the rates of synonymous substitutions for 613 core genes is higher than that of the non-synonymous substitutions. The resulting core proteins will not be altered and remain conserved during evolution.

