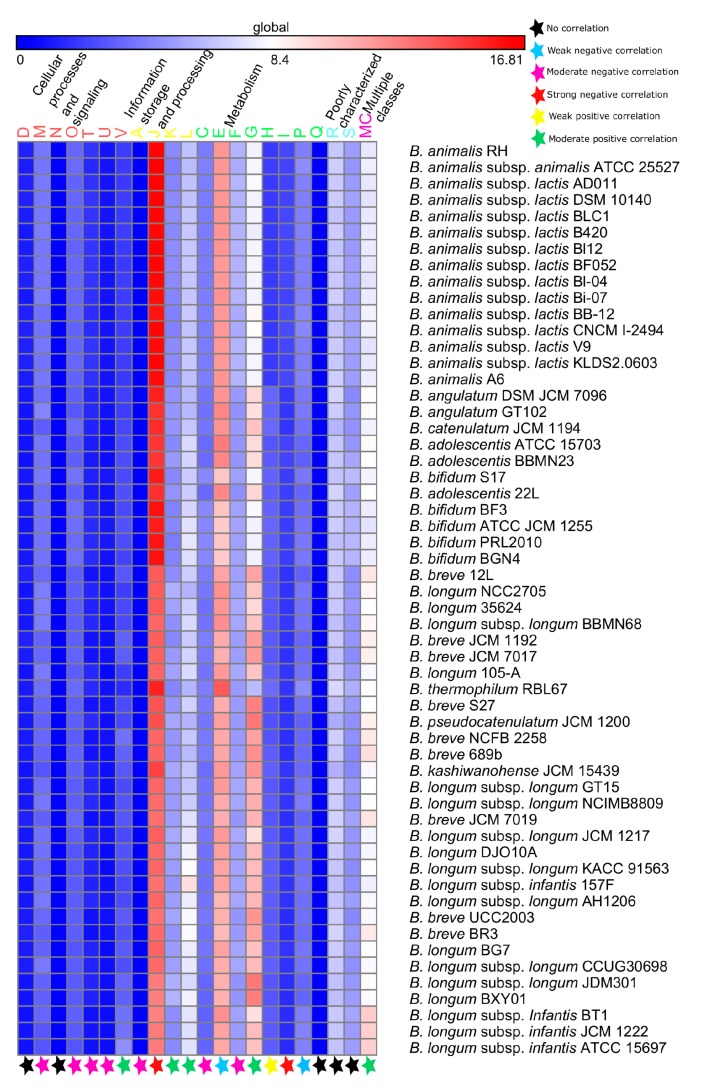
Figure 4.
An abundance heat map of the different COGs classes present in the genomes of the 56 PHBifs. The strains are sorted (top to bottom) according to increasing genome sizes. D: Cell cycle control, cell division, chromosome partitioning; M: Cell motility; N: Cell wall/membrane/envelope biogenesis; O: Posttranslational modification, protein turnover, chaperones; T: Signal transduction mechanisms; U: Intracellular trafficking, secretion, and vesicular transport; V: Defense mechanisms; A: RNA processing and modification; J: Translation, ribosomal structure and biogenesis; K: Transcription; L: Replication, recombination and repair; C: Energy production and conversion; E: Amino acid transport and metabolism; F: Nucleotide transport and metabolism; G: Carbohydrate transport and metabolism; H: Coenzyme transport and metabolism; I: Lipid transport and metabolism; P: Inorganic ion transport and metabolism; Q: Secondary metabolites biosynthesis, transport and catabolism; R: General function prediction only; S: Function unknown; MC: Multiple classes. The Spearman’s R statistic (p-value < 0.001) was used to estimate the significant correlation between the two groups, including COGs class and genome-size, star represents the status of correlation; for details refer to Table S9.

