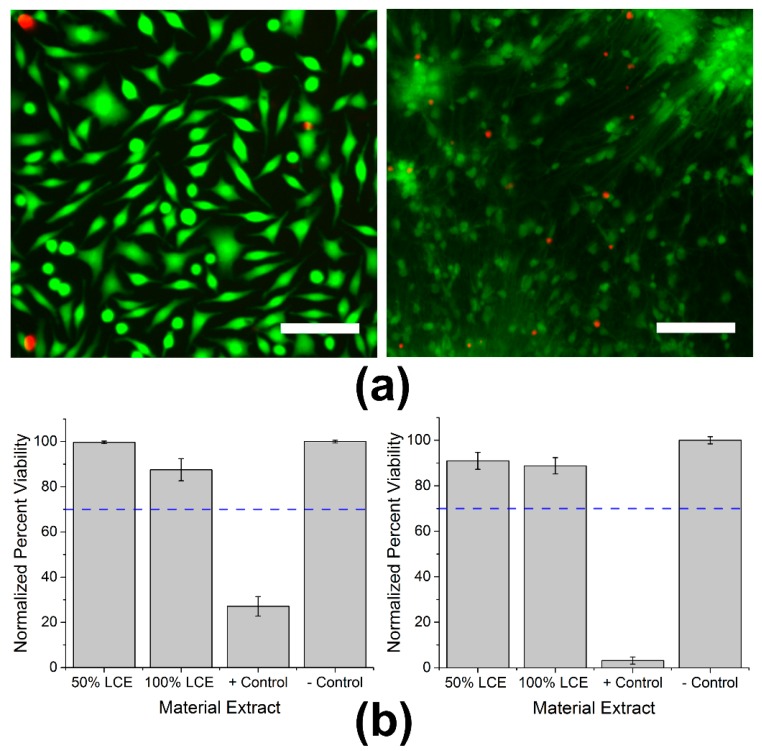
Figure 2.
Cytotoxicity assays using both NCTC fibroblasts and primary cortical neurons: (a) Fluorescent images of NCTC fibroblasts (left) and primary murine-derived cortical neurons (right) stained with CaAM (green) for live cells and EthD-1 (red) for apoptotic cells. Scale bars represent 100 μm (b) Mean normalized fibroblast (left) and cortical neuron (right) viability percentages of LCE extract at 50% and 100% concentrations, positive control, and negative control. Blue dotted line at 70% represents the ISO threshold set for non-cytotoxic materials.

