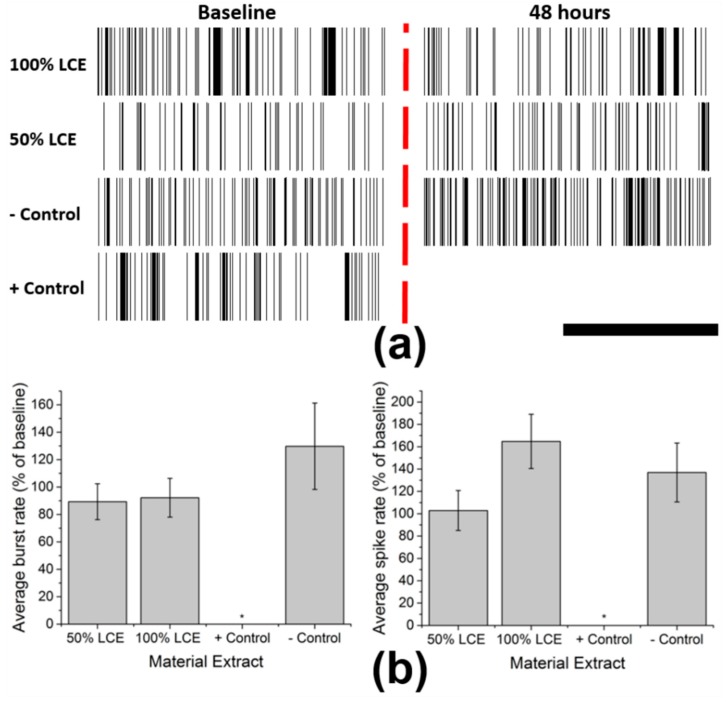
Figure 3.
Functional neurotoxicity assays using primary cortical neurons: (a) Representative raster plots of spontaneous activity from single electrodes before (left) and after (right) each treatment. Scale bar represents 3 s. (b) Average Burst rate (left) and spike rate (right) of cortical neurons after 48 h exposure to LCE extract at 50% and 100% concentrations, positive control, and negative control.

