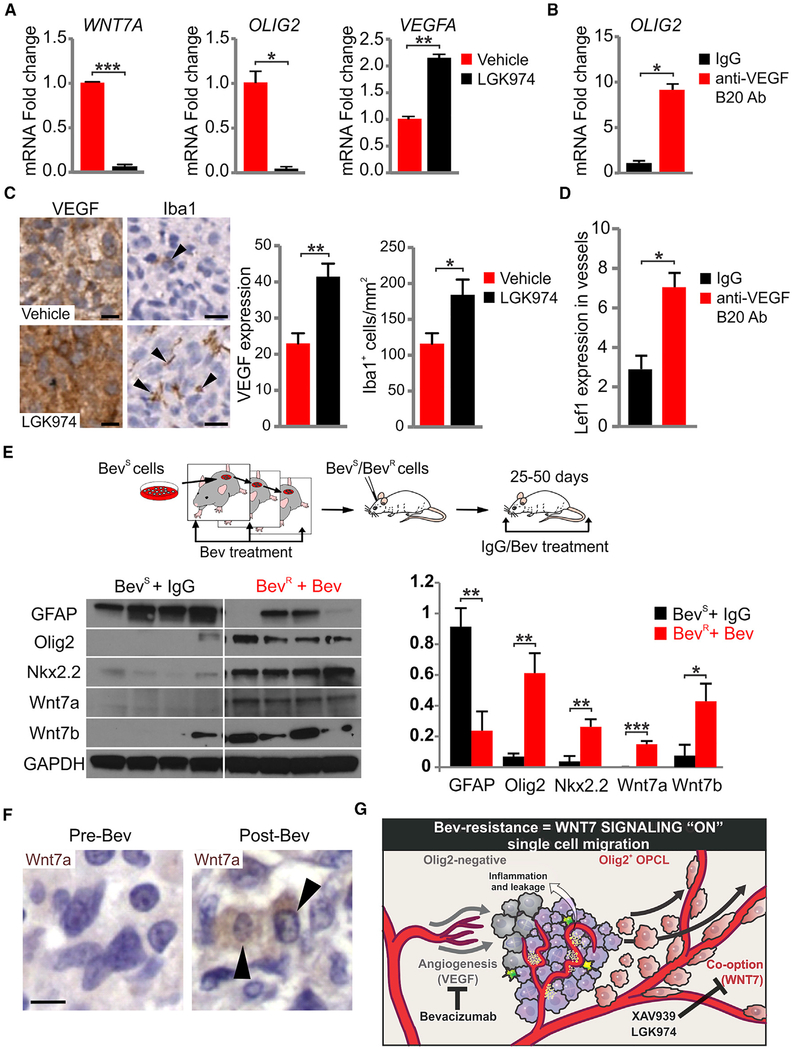
Figure 7. Wnt7 Signaling Is Upregulated by Anti-VEGF Therapy.
(A) Quantitative RT-PCR using vehicle and LGK974-treated MGG8 cells (100 mM LGK974 for 3 days). GAPDH was used for expression normalization. Data are means ± SEM (n = 2 experiments with technical triplicates, *p < 0.05, **p < 0.01, ***p < 0.001).
(B) Quantitative RT-PCR using IgG- and B20 (anti-VEGF)-treated MGG8 cells. GAPDH was used for expression normalization. Data are means ± SEM (n = 2 experiments with technical triplicates, *p < 0.05).
(C) VEGF and Iba1 immunostaining and quantification of 7 days of vehicle and LGK974-treated MGG8 tumors. Black arrowheads indicate Iba1+ cells. Data are means ± SEM (n = 3 mice per group, *p < 0.05, **p < 0.01). Scale bars, 10 μm.
(D) B20 administration in MGG8-transplanted animals for 10 days (10 mg/kg once a day intraperitoneally). Lef1+ cells per vessels were quantified in IgG and B20 animals. Data are means ± SEM (n = 6 mice for IgG cohort and n = 16 mice for B20 cohort, *p < 0.05).
(E) Model of progressive U87 glioma cell resistance. Western blot and densitometry analysis using lysates from IgG-treated Bev-sensitive (BevS) and Bev-treated BevR tumors. Data are means ± SEM (n = 4 mice per genotype, *p < 0.05, **p < 0.01, ***p < 0.001).
(F) Human GBM paired samples taken at biopsy pre-treatment and postmortem/post-treatment with Bev and stained for Wnt7a and H&E. Black arrowheads indicate Wnt7a+ cells. Scale bar, 10 μm.
(G) Schematic summarizing the effects of glial subtypes on vessel co-option and the tumor microenvironment, and their modulation upon VEGF and Wnt signaling inhibition. See also Figure S6

