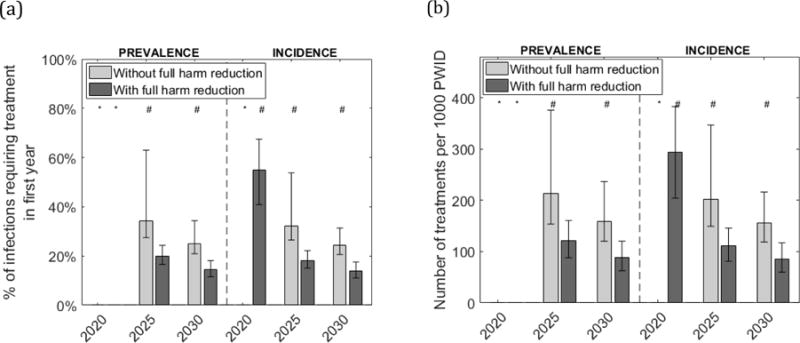
Figure 2.

Required yearly HCV treatment rate needed to decrease HCV prevalence or incidence by 90% by 2020/25/30.
Figures show projected number per 1000 PWID needing to be HCV-treated each year (2b), and percentage of infections this translates to in the first year (2a), to result in a 90% reduction in chronic HCV prevalence or incidence by 2020, 2025 or 2030, with or without full harm reduction (50% coverage of both SSP and MAT). In both figures, bars show the median projections from a sample of 1000 model runs and whiskers show the 95% credibility intervals. *Less than 5% of parameter sets achieved the target. #Only a proportion of parameter sets achieved the target.
