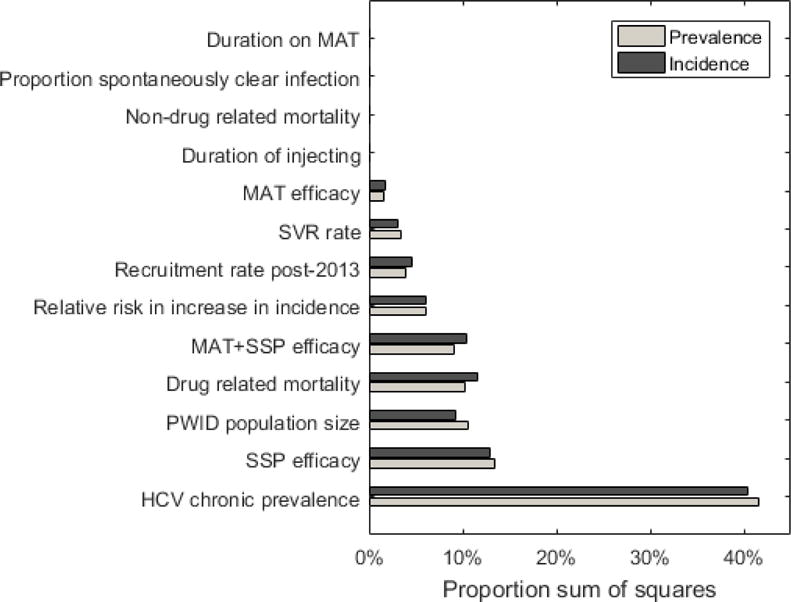
Figure 3.

Contribution of each model parameter to the variability in the required number of HCV treatments to reduce incidence/prevalence by 90% by 2030.
Figures show the proportion of sum of squares each of the parameters contributes to the model outcome, indicating the importance of the parameters to the variation that is seen in the treatment number needed to reduce prevalence and incidence by 90% by 2030. The projections assume 50% coverage of SSP and MAT.
