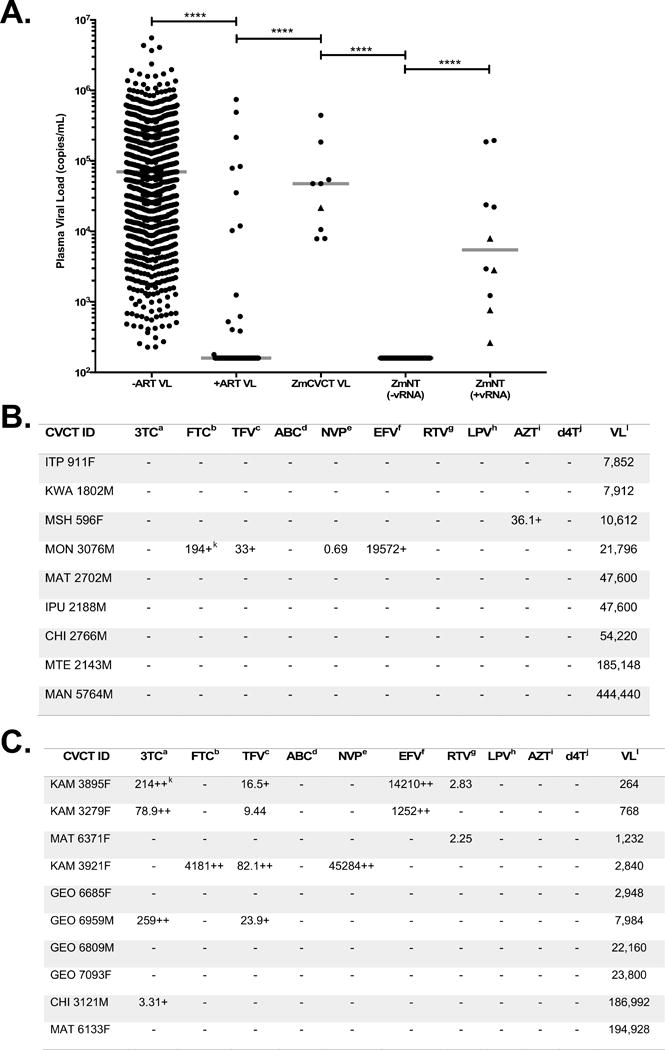
Figure 1. Plasma viral loads (VL) and ARV concentrations in Zambian donors reportedly on ART.

(A) Plasma VL (copies/mL) were quantified using a quantitative RT-PCR assay (see Methods). VL from Zambian ART-naïve (-ART VL) and ART-treated (+ART VL) individuals from the Rwanda-Zambia HIV Research Group (RZHRG) database were compared to those from Zambian (Zm) transmitting partners from nine linked transmission pairs (ZmCVCT) and 50 Zm Non-Transmitting (ZmNT) donors (vRNA- or vRNA+). Median VL represented by gray lines. Triangles indicate individuals with at least two detectable ARV in their plasma. (B) Plasma concentration of 10 different ARV and corresponding VL from ZmCVCT transmitting partners. (C) Plasma concentration of 10 different ARV and corresponding VL from vRNA+ ZmNT partners. Generic drug names (superscripts a-j), EC50 and EC90 for these ARVs are provided in Supplemental Table 1. Drug concentrations are in nM; + = >EC50; ++ = >EC90. Plasma VL - copies/mL.
