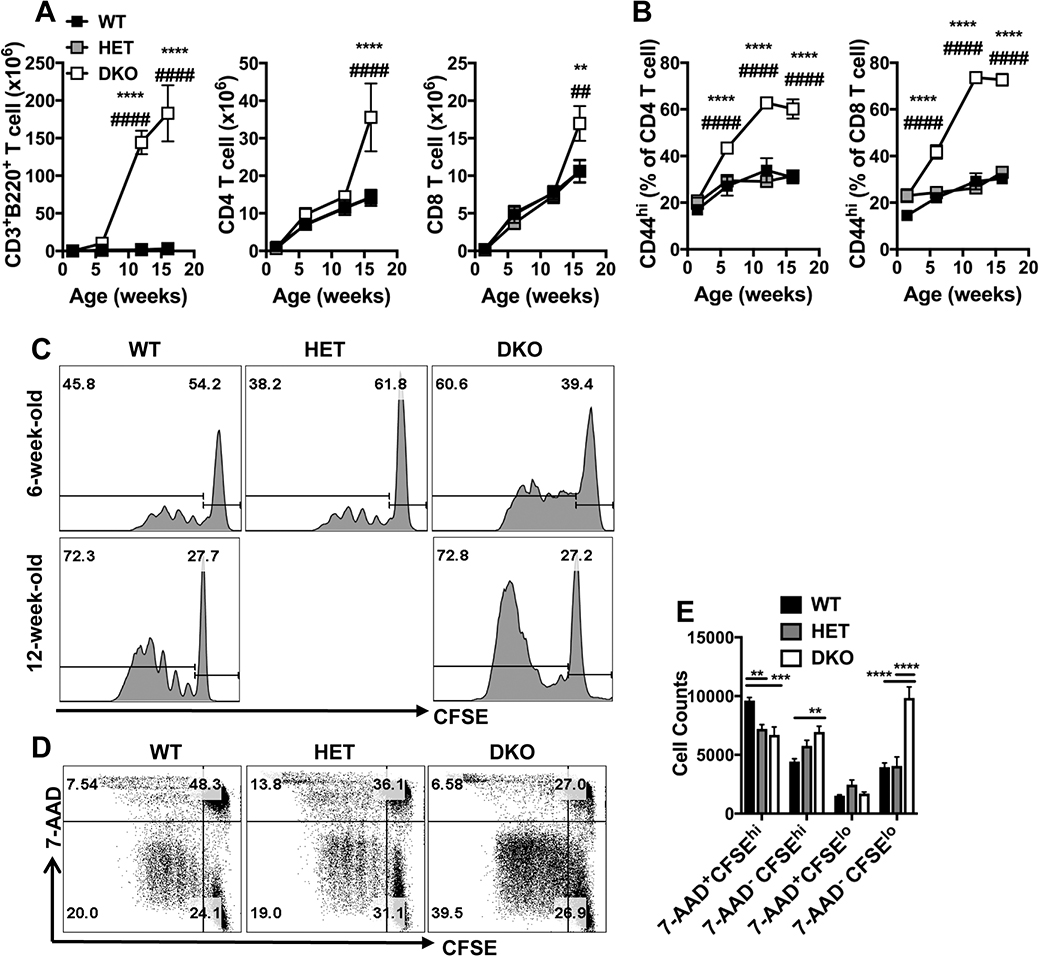
Figure 2. Impact of Casp8 and RIPK3 deficiency on T cell homeostasis at different ages.
(A and B) Graphs showing levels of T cell subsets represented as the mean ± S.E.M. in spleens of WT, HET and DKO mice at the indicated weeks of ages. Splenic CD45+ leukocytes were gated to identify B220+CD3+ T cells, B220–CD3+CD8–CD4+ (CD4) and B220–CD3+CD4–CD8+ (CD8) T cells. Graphs showing the total numbers of the T cell subsets (A) and the frequencies of CD44hi CD4 and CD44hi CD8 T cells (B). Significant differences between DKO and WT (*) or HET (#) mice are indicated as * or #, respectively, * or #, p < 0.05; ** or ##, p < 0.01; *** or ###, p < 0.001; **** or ####, p < 0.0001.
(C - E) Flow cytometry plots showing CD8 T cell proliferation and death. CFSE dilution analyses of purified splenic T cells after stimulation with anti-CD3 and anti-CD28 for 72 hr. Representative histograms comparing CFSE distribution of 7-AAD– CD8 T cells from mice at the indicated ages (C). Representative plots showing CFSE vs. 7-AAD of cells from 6-week-old mice (D) and bar graphs showing the numbers of different cell population recovered in culture following stimulation, represented as the mean ± S.E.M. Combined data of n = 11 mice from up to three independent experiments are shown. **, p < 0.01; ***, p < 0.001; ****, p < 0.0001.

