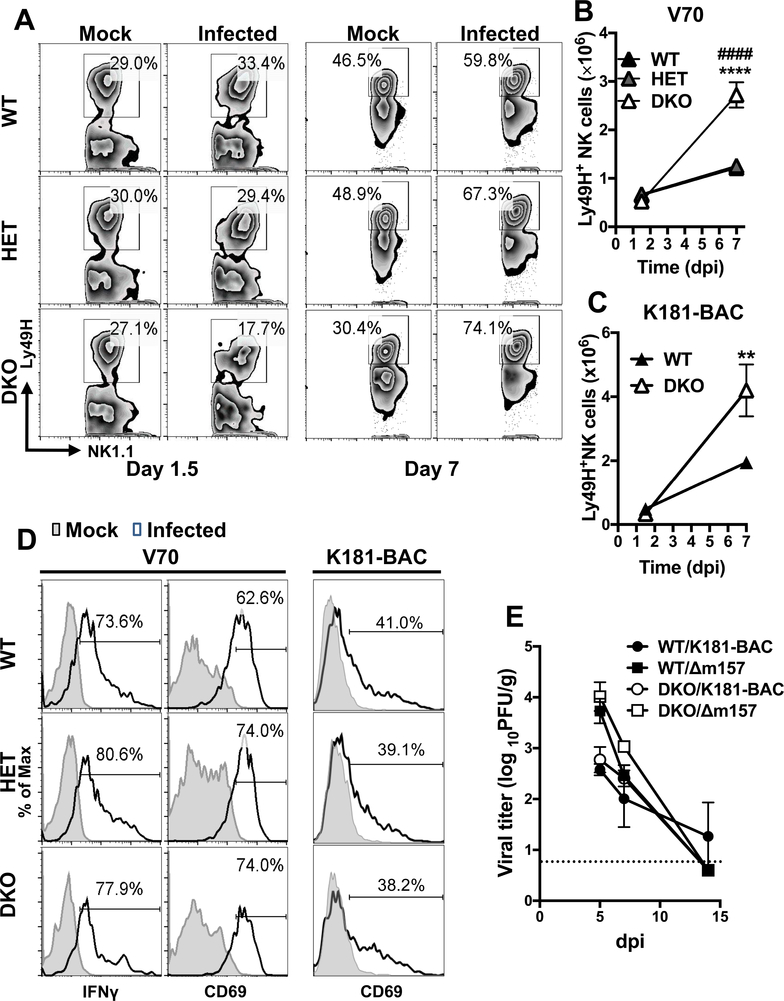
Figure 4. Impact of Casp8 and RIPK3 deficiency on NK cell response following MCMV infection.
(A – D) Graphs showing the levels and phenotype of Ly49H+ NK cells responding to MCMV infection. Splenic total CD45+CD3–B220–NK1.1+ (NK) cells gated to identify Ly49H+ NK cells from 8-week-old WT, HET and DKO mice infected for 1.5 or 7 days with MCMV as described in Figure 3. Representative flow cytometry contour plots comparing Ly49H+ NK cell frequencies (A) and graph showing mean total numbers ± S.E.M (B) in mock or MCMV V70-infected mice. Graph showing mean numbers ± S.E.M. of Ly49H+ NK cells in K181-BAC-infected mice (C). Representative histograms showing frequencies of Ly49H+ NK cells expressing IFNγ or CD69 at day 1.5 post infection with strain V70 or K181-BAC (D). (E) Graph showing viral titers in spleens. WT and DKO mice were i.p.-inoculated with 106 PFU MCMV K181-BAC or Δm157. Tissues were harvested on day 5, 7 and 14 post infection and homogenates were analyzed by plaque assay. Dash line indicates limit of detection. * and # denote the significantly differences of DKO cells relative to WT and HET cells, respectively. ** or ##, p < 0.01; *** or ###, p < 0.001. Data represent two to three independent experiments using n = 4 – 5 mice per group.

