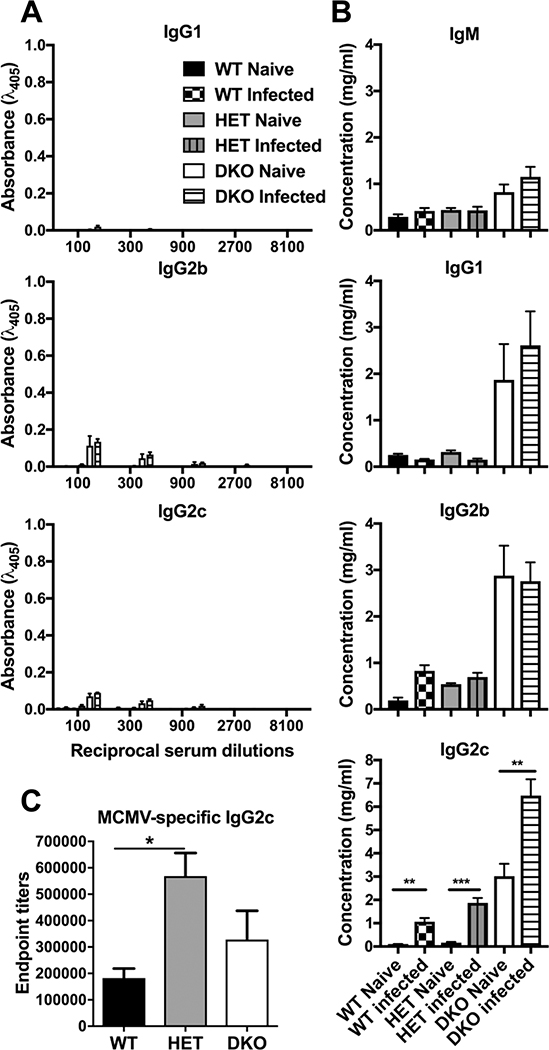
Figure 6. Impact of Casp8 and RIPK3 deficiency on Ab levels following MCMV infection.
Mean ± S.E.M. concentrations of different Ig isotypes in sera from mice infected as described in Fig. 5H – N. Bars graph depict relative dsDNA-reactive IgG levels (A), total Ab concentrations (B) and MCMV-specific IgG2c endpoint titers (C) as derived by ELISA. *, p < 0.05; **, p < 0.01; ***, p < 0.001. Data represent one experiment using n = 5 mice per group.

