FIG 5.
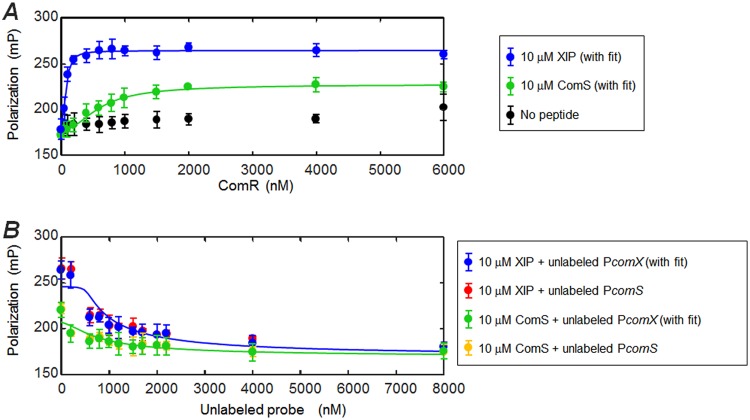
ComS and XIP interact with ComR to bind the comX promoter. A fluorescence polarization assay testing interaction of ComS and XIP peptides with ComR and the PcomX transcriptional activation site was performed. The DNA probe was labeled with a Bodipy FL-X fluorophore. (A) Titration of ComR into a solution containing 10 µM XIP (blue) or full-length ComS (green), labeled DNA probe (1 nM), and 0.05 mg ml−1 salmon DNA. The negative control (black) contained no ComS or XIP peptide. (B) Competition assay in which unlabeled promoter sequence DNA was titrated into a solution containing ComR (1.5 µM), fluorescent DNA probe (1 nM), and peptide (either ComS or XIP, 10 µM). Unlabeled PcomX DNA was used with XIP (blue) and ComS (green). An unlabeled PcomS probe was also tested for its ability to compete with the fluorescent PcomX probe in the presence of XIP (red) and ComS (gold). Solid curves indicate binding and competition behavior predicted by the two-step model described in Materials and Methods, in which peptide (ComS or XIP) first forms a multimeric complex with ComR (k1, n) and a single copy of this complex binds to the (labeled or unlabeled) PcomX DNA (k2). For ComS binding/competition (green), the curves represent the following values: k1 = 3.2 μM, k2 = 2.2 nM, n = 2.5. For XIP binding/competition (blue), the curves represent the following values: k1 = 7.3 μM, k2 = 33 nM, n = 2.4.

