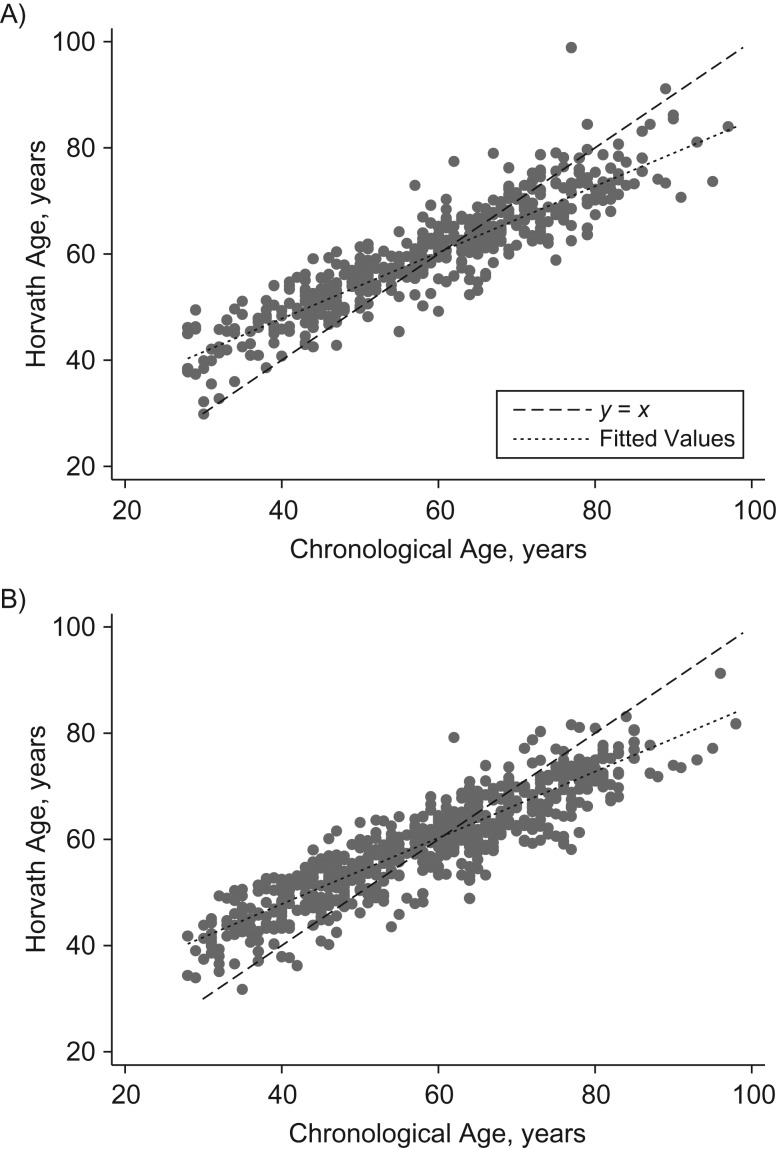
Figure 1.
Horvath DNA methylation age (years) according to chronological age (years) among men (A) and women (B) in the UK Household Longitudinal Study (n = 1,093), 2011–2012. The solid line represents the line of best fit, and the dashed line is the y = x line. ΔAge (years) is the difference between DNA methylation age and chronological age (i.e., the vertical distance from a dot to the y = x line). If mean Δage were constant with age, observations would be approximately symmetrical about the y = x line. Instead, Δage decreases with chronological age. UK, United Kingdom.

