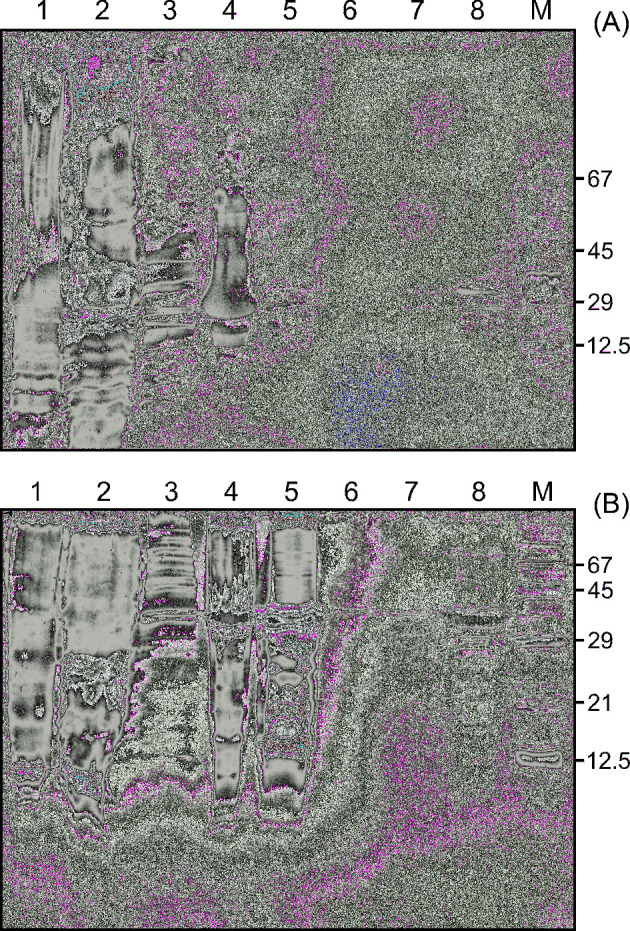
Figure 2.

Bacterial expression and purification of CaPho15p (A) and CpPho15p (B). SDS-PAGE shows the protein composition of cell lysate (lane 1), soluble cytoplasmic fraction (lane 2), wash of the inclusion bodies (lane 3), inclusion bodies (lane 4), solubilised inclusion bodies after dialysis (lane 5), flow-through fraction after His-tagged protein binding to Ni-NTA Agarose (lane 6), wash of the column (lane 7), purified phosphatase (lane 8). M—Molecular weight marker.
