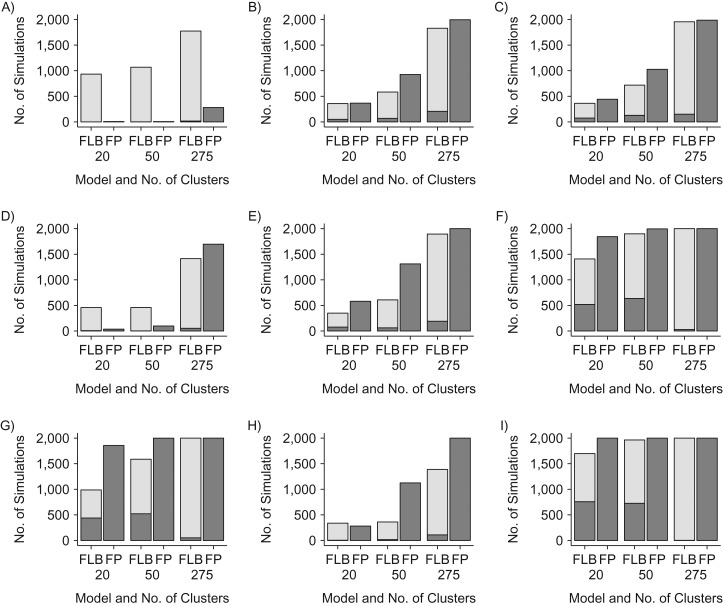
Figure 1.
Convergence and degenerate estimates for the standard deviation of random intercepts in the frequentist log binomial (FLB) and frequentist Poisson (FP) random-intercept models for scenarios described in Table 1. A) Scenario 3; B) scenario 4; C) scenario 5; D) scenario 6; E) scenario 7; F) scenario 8; G) scenario 9; H) scenario 10; I) scenario 11. See Table 1 for the full scenario descriptions. Light gray bars represent the number of simulations for which the model did not converge. Dark gray bars represent the number of simulations for which the model had a degenerate variance estimate. For example, the fifth bar in panel E for scenario 7 shows the results for the FLB random-intercept model for data sets simulated with 275 clusters: In 1,703 simulations, the model did not converge, and among the remaining models that did converge, 191 had a degenerate estimate for the variance of the random intercepts.

