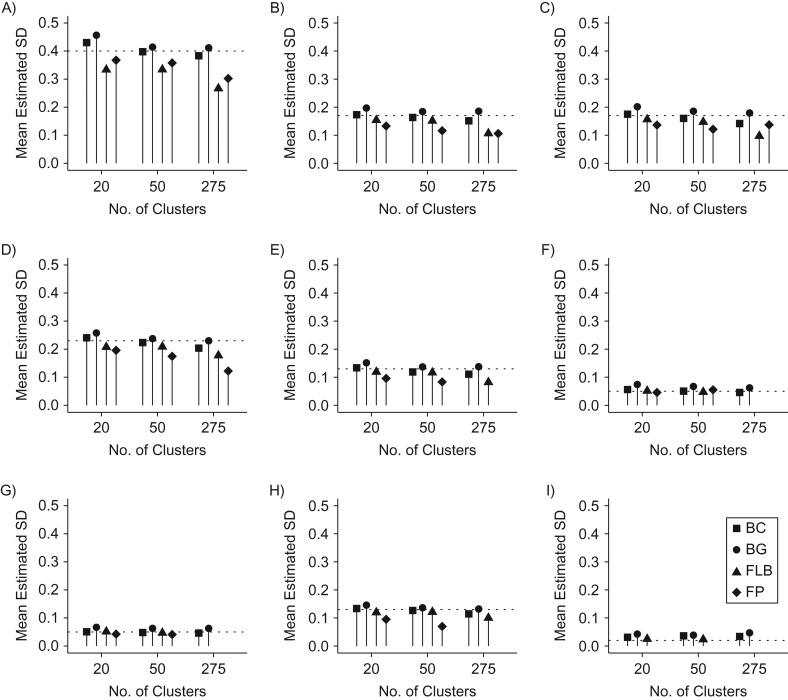
Figure 3.
Mean estimated standard deviation (SD) in random intercepts across exposure/outcome scenarios and cluster sizes, by model type, for scenarios described in Table 1. A) Scenario 3; B) scenario 4; C) scenario 5; D) scenario 6; E) scenario 7; F) scenario 8; G) scenario 9; H) scenario 10; I) scenario 11. See Table 1 for the full scenario descriptions. Note that some scenarios/clusters do not have markers for the frequentist models because there were no models that converged and had nondegenerate SD estimates under these fits. “BC” (squares) indicates a Bayesian log binomial random intercept with a half-Cauchy(0, 5) prior distribution on the SD; “BG” (circles) indicates a Bayesian log binomial random intercept with a gamma(2, 0.1) prior distribution on the SD; “FLB” (triangles) indicates results for the frequentist fit of the log binomial random-intercept model; and “FP” (diamonds) indicates results for the frequentist fit of the Poisson random-intercept model.

