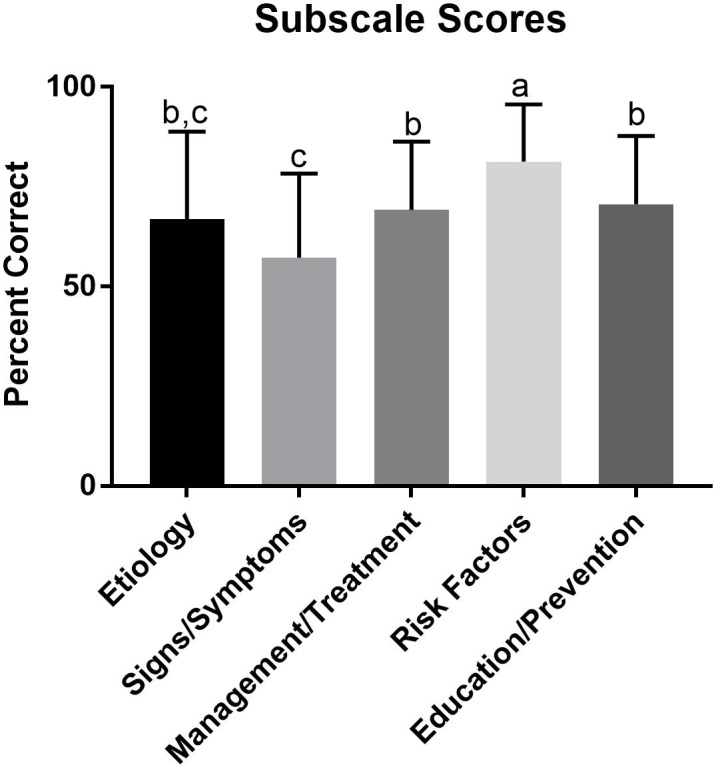
Figure 1. Scores on domains of eating disorder knowledge.

Subscale scores from the present study. The percent for each subscale was the sum of correct answers divided by the sum of total questions. The percents for all participants were then averaged to determine overall average percent. a, denotes a significant difference from etiology, signs and symptoms, management, and education. b, denotes a significant difference from signs and symptoms and risk factors. c, denotes a significant difference from management, risk factors, and education. The subscales sharing letters are not significantly different (p > 0.05).
