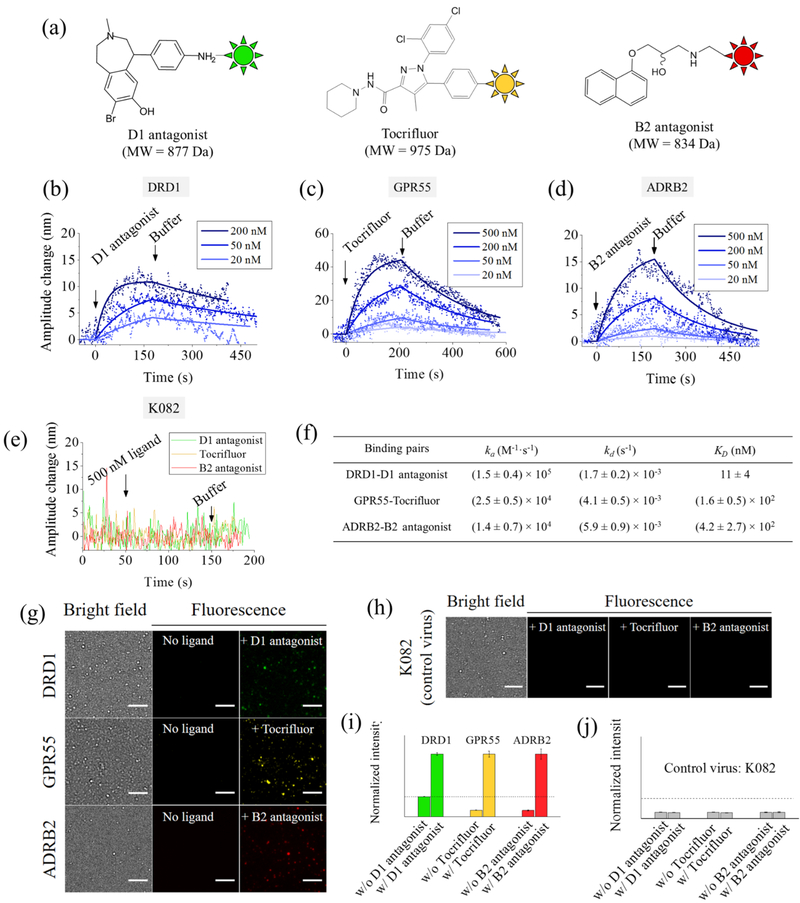
Figure 3.
Measuring ligand binding to GPCR with virion oscillators. (a) Chemical structures of D1 antagonist, Tocrifluor, and B2 antagonist. (b–d) Binding kinetic curves (oscillation amplitude vs time) of D1 antagonist−DRD1, Tocrifluor−GPR55, and B2 antagonist−ADRB2 interactions, respectively, where the solid lines are global fitting of the data to the first order kinetics. Each binding curve is an average over at least five individual virions. (e) Control experiments using virion oscillators prepared with K082 virion, showing no binding to any of the ligands. Applied voltage: amplitude = 0.4 V and frequency = 5 Hz. Buffer: 40-fold diluted PBS (4 mM) and pH = 7.4. (f) Kinetic and equilibrium constants of ligand binding to GPCRs. (g) Validation of specific binding with fluorescence detection. Bright field and fluorescence images of virions expressed with different GPCRs obtained before and after adding the corresponding ligands, and the fluorescence images confirm the specific binding of the ligands to the corresponding receptors. Scale bar, 5 μm. (h) Further control experiments to examine nonspecific binding using the K082 virions. None of the three ligands generated observable fluorescence changes, showing no nonspecific binding in the measured binding kinetics shown in (b–d). Scale bar, 5 μm. (i) Fluorescent intensity of virions with DRD1, GPR55, and ADRB2 before and after adding the corresponding ligands. (j) Fluorescence image intensity of K082 virions before and after adding the three ligands. The dashed lines in (i) and (j) indicate background fluorescence levels.

