
Fig. 2 |. Deep and reproducible coverage of tumor tissue proteomes and phosphoproteomes across three laboratories.
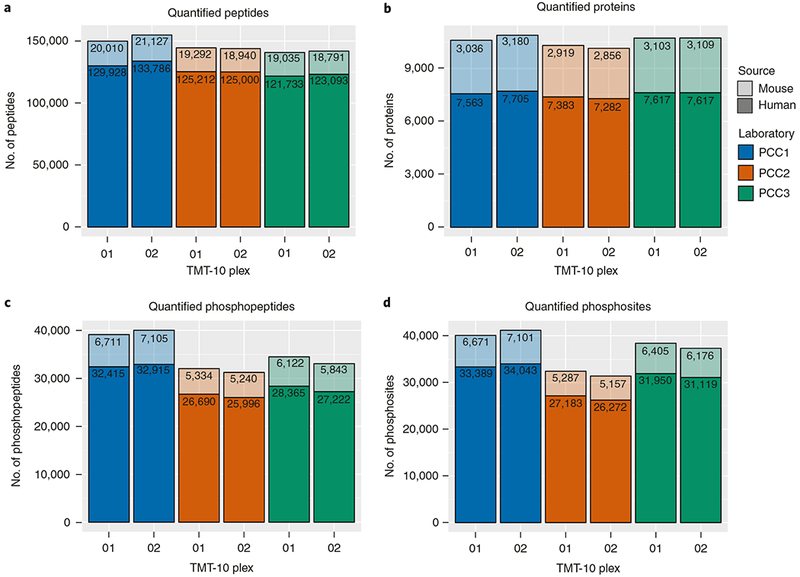
a-d, Bar charts depicting the number of quantified distinct peptide sequences (a) and proteins (b) identified in basic RP fractions of proteome measurements, and the number of distinct phosphorylated peptides (c) and individual phosphorylation sites (d) quantified in the metal-affinity enriched fractions. Solid-colored bars represent the proportion of human features and shaded bars represent the proportion of mouse-specific features. Numbers inside the bars represent the numbers of quantified human and mouse features, respectively. PDX models used in this study were approved by the institutional animal care and use committee at Washington University in St. Louis.