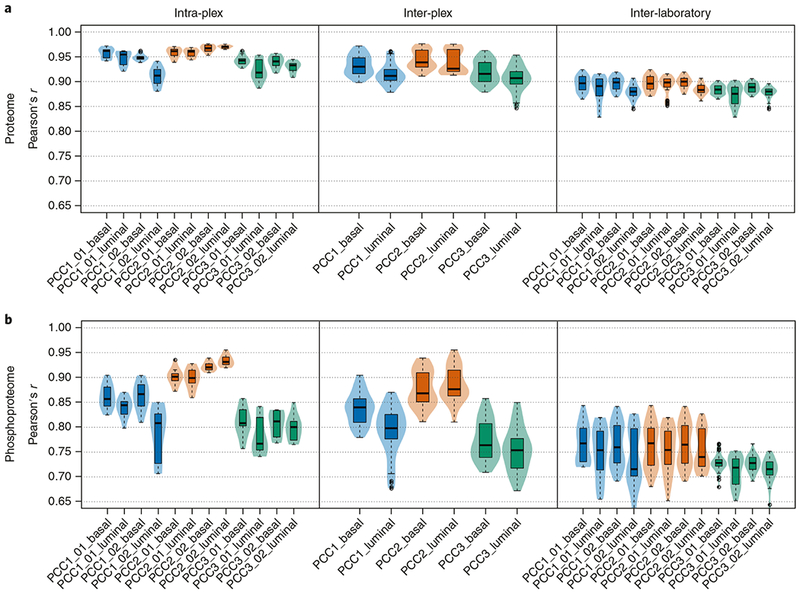
Fig. 3 |. Assessment of the variability of TMT quantitation.

Our experimental design enables the assessment of intra-plex, inter-plex, and inter-laboratory variation of TMT quantitation. Pearson correlation coefficients between replicate measurements were calculated and visualized in box-and-whiskers plots. a, Correlations calculated from proteome measurements comparing intra-plex replicates (left), inter-plex replicates (middle), and inter-laboratory replicates (right). b, Correlations of quantified phosphorylation sites. PDX models used in this study were approved by the institutional animal care and use committee at Washington University in St. Louis.
