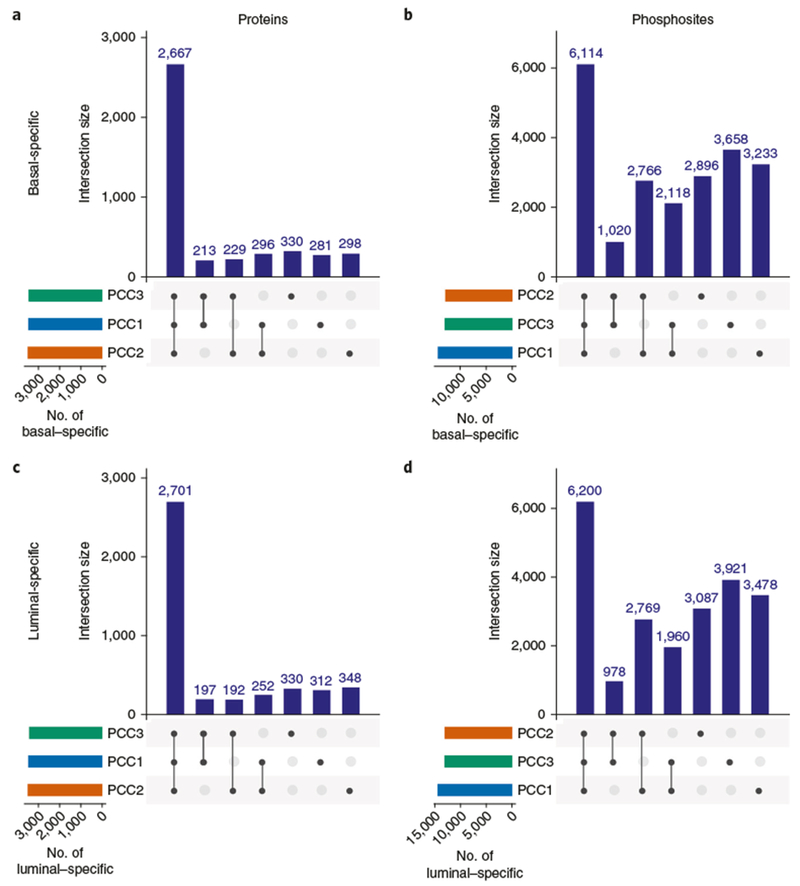
Fig. 4 |. Breast cancer subtype-specific protein and phosphorylation site expression identified by three laboratories.

Differences in the expression of proteins and phosphorylation sites between luminal and basal tumor subtypes were determined by a two-sample moderated t test at a 1% FDR. The results of the analysis are illustrated as ‘UpSet’ plots. Horizontal bars indicate total number of features detected by each laboratory; vertical bars depict the number of jointly detected features, as indicated by the layout matrix below. a,b, Comparison of proteins (a) and phosphorylation sites (b) highly expressed in the basal subtype. c,d, Comparison of proteins (c) and phosphorylation sites (d) highly expressed in the luminal subtype. Approximately two-thirds of the phosphosites that were quantified as differentially expressed by a single laboratory were also only detected by a single laboratory. PDX models used in this study were approved by the institutional animal care and use committee at Washington University in St. Louis.
