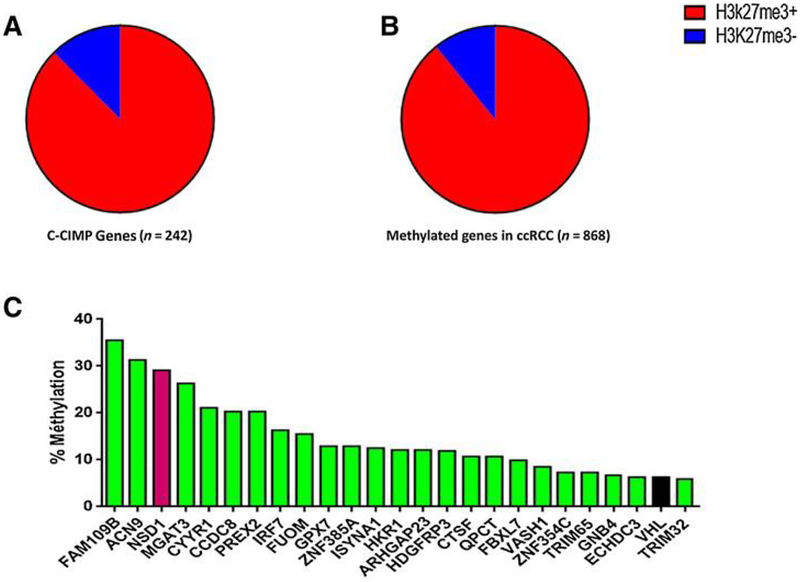
Figure 3.
Correlation between DNA methylation and polycomb mark. A, Distribution of CCIMP genes marked by H3K27me3 in fetal kidney samples. B, Distribution of genes that gain DNA methylation in ccRCC according to H3K27me3 mark status in fetal kidney samples. C, Twenty-five genes identified as frequently methylated and repressed in ccRCC. Rate of Λ/SD7 methylation (red) is high compared with that of VHL (black).

