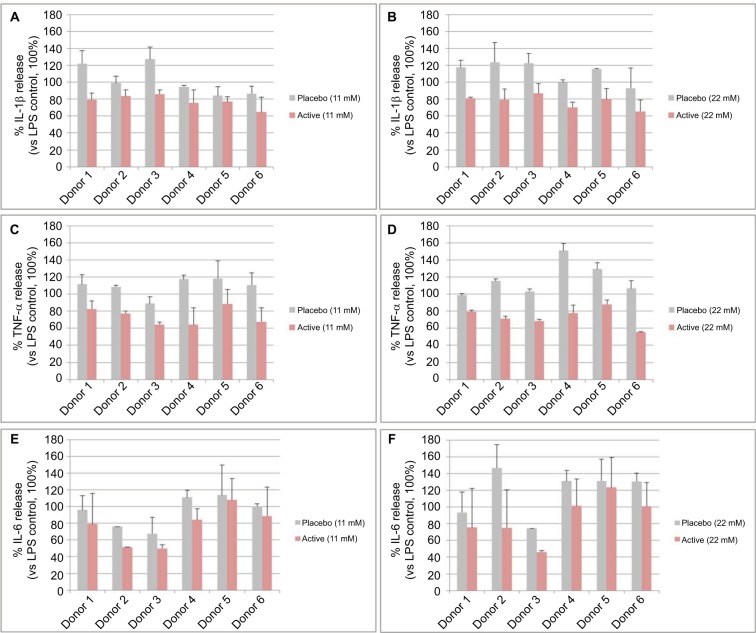
Figure 6.
Single donor responses to diluted placebo or active globules.
Notes: The graphs in the figure represent the percentage of IL-1β (A, B), TNF-α (C, D), and IL-6 (E, F) release (vs LPS control, 100%) of primary enriched monocytes from 6 donors, exposed to 10 ng/mL of LPS for 24 hours and treated with 1 capsule of 2LARTH® (Active) or placebo at 2 lactose-saccharose globules concentrations (11 and 22 mM). Data are expressed as mean ± SD percentage (vs LPS control, 100%).
Abbreviations: LPS, lipopolysaccharide; TNF, tumor necrosis factor.

