Figure 1.

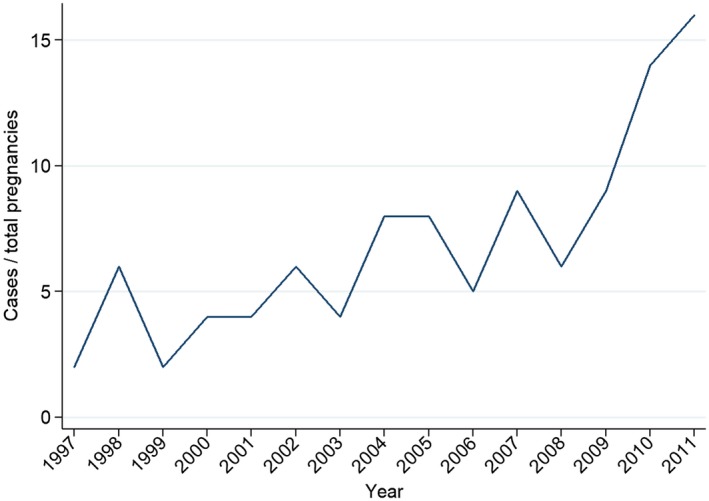
Line graph of cases of cirrhosis per total number of pregnancies in Sweden 1997‐2011. P = 0.02 when cases diagnosed in 2002‐2006 are compared with those in 2007‐2011.

Line graph of cases of cirrhosis per total number of pregnancies in Sweden 1997‐2011. P = 0.02 when cases diagnosed in 2002‐2006 are compared with those in 2007‐2011.