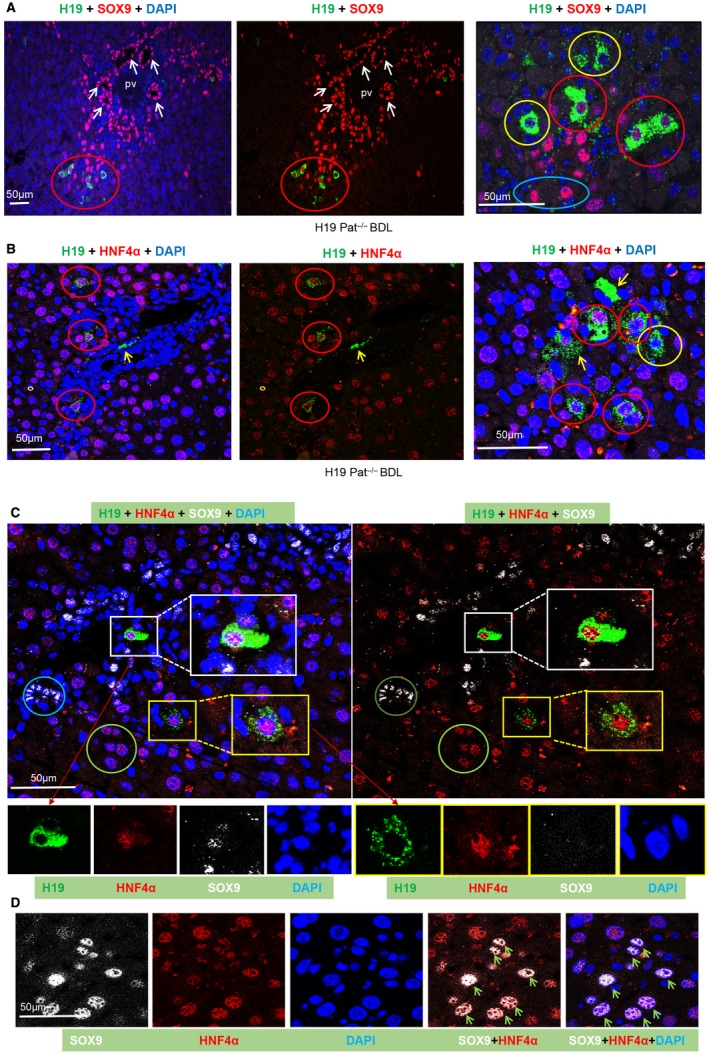
Figure 2.

H19RNA is expressed in SOX9+ progenitor cells, or HNF4α+ hepatocytes, or SOX9+/HNF4α+ cells in BDL mice. (A‐C) Representative images of H19RNA and (A) SOX9, (B) HNF4α, or (C) SOX9+HNF4α colabeling are shown at lower magnification (scale bar, 50 µm) (left and middle panels) and higher magnification (scale bar, 20 µm) (right panel). (D) Colocalization of HNF4α and SOX9 are shown in different single and merged channels (scale bar, 50 µm). Red, SOX9 (A) and HNF4α (B‐D); green, H19RNA; blue, DAPI; yellow arrows, H19RNA+ cells; green arrows, SOX9 and HNF4α double‐positive cells; red circle, H19 and HNF4α double‐positive cells; yellow circle, H19 single‐labeling cells; blue circle, SOX9 single‐labeling cells; green circle, HNF4α single‐labeling cell; white square, H19RNA, SOX9, and HNF4α triple‐labeling cells shown in different single enlarged channels; yellow square, H19RNA and HNF4α double‐labeling cells shown in different single enlarged channels.
