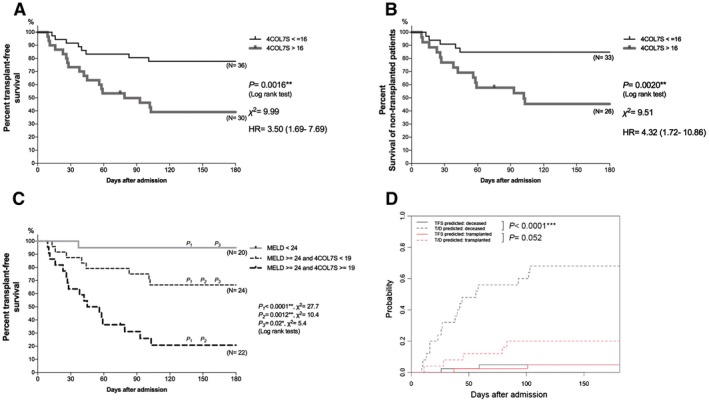
Figure 4.

Kaplan–Meier analysis of 180‐day survival. In 66 NAA‐ALF cases with available 4COL7S levels, survival from the onset of symptoms up to 180 days was compared. Patients are stratified by 4COL7S at the optimal cut‐off value generated by ROC curve analyses. (A) Kaplan–Meier analysis was performed for 180‐day TFS, with 8 versus 18 events. (B) Kaplan–Meier analysis for survival of patients without a transplant, with 5 versus 14 events. (C) TFS of three groups stratified by MELD score <24, MELD score >24 + 4COL7S <19 ng/mL, and MELD score >24 + 4COL7S >19 ng/mL, with 1 versus 8 versus 17 events. (D) Competing risk estimates of cumulative incidence function for death (with transplantation as a competing risk) by Gray’s test of a Cox regression model incorporating 4COL7S, MELD, age, and NH3. P values from log‐rank tests are shown. *P < 0.05; **P < 0.01; ***P < 0.0001. Abbreviation: HR, hazard ratio.
