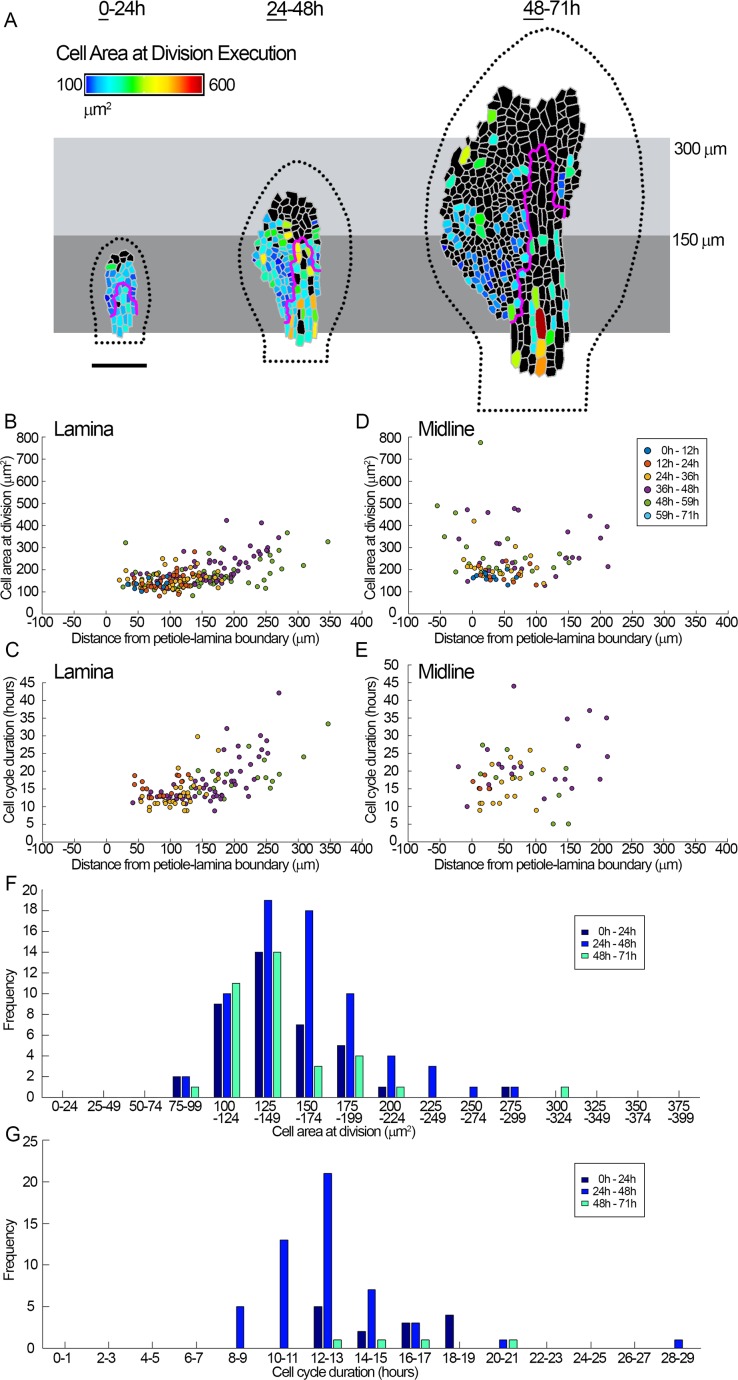
Fig 2. Quantification of cell division execution.
Time-lapse imaging of a spch leaf imaged at 2-h intervals over 3 d (0–71 h, last time point in series not shown). Leaf widths for the first time point (left to right) are 0.09, 0.21, and 0.36 mm. (A) Cell area at division execution (heat map) for cells amenable to tracking, visualised over 24-h intervals and shown on the first time point of the interval (underlined). Cells that did not divide during the 24-h interval are coloured black. If cells divided more than once in the 24-h interval, the area of the first division is shown. Leaf outline indicated by dotted black line. The petiole-lamina boundary was defined as described in Fig 1. Grey boxes are aligned to the petiole-lamina boundary and extend to 150 or 300 μm. Cells within the magenta line were assigned as being within the midline region. (B-E) Data grouped into intervals of 12 h (inset in D). Means (μ) are shown with ± ranges indicating 1.96 × standard error, corresponding to the 95% confidence limit for a normal distribution. (B, D) Area of cells at division execution versus distance from the petiole-lamina boundary. (B) Cells in the lamina (μ = 170.8 ± 7.7 μm2), mean cell area of cells within the proximal 150 μm = 151 ± 6.5 μm2, mean cell area of cells outside the proximal 150 μm = 203 ± 9.7 μm2. (D) Cells in the midline region (μ = 243.0 ± 22.4 μm2). (C, E) Cell cycle duration versus distance from the petiole-lamina boundary. (C) Cells in the lamina (μ = 16.2 ± 1.0 h). For cells in the proximal 150 μm, μ = 13.9 ± 0.8 h. For cells outside the proximal 150 μm, μ = 19.4 ± 1.8 h. (E) Cells in the midline (μ = 18.9 ± 2.1 h). (F, G) Histograms of cell area at time of division execution, and cell cycle duration, during time intervals of 24 h (as in A). (F) Area at division execution for cells within the proximal 150 μm of the lamina (μ = {145.6, 158.3, 142.6}, standard deviation σ = {36.3, 37.9, 40.1}). (G) Cell cycle duration for cells within the proximal 150 μm of the lamina (μ = {15.8, 13.1, 16.7}, σ = {2.5, 3.3, 2.7}). Measurements of cell area and cell cycle duration are accurate to within 2 h (the time interval between imaging) of division execution. Scale bar = 100 μm. See also S7 Fig. Source data are available from https://figshare.com/s/b14c8e6cb1fc5135dd87. spch, speechless.

