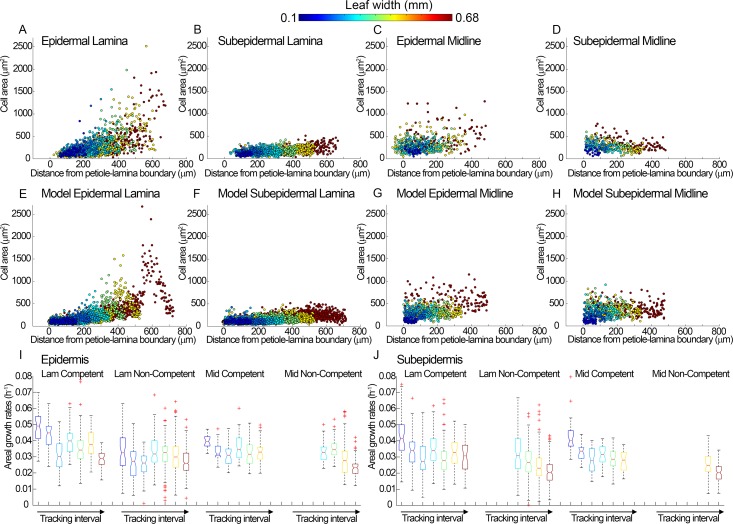
Fig 3. Quantification of cell areas and growth rates in epidermal and subepidermal data and models.
(A-D) Data from cells amenable to tracking in the time-lapse experiment shown in Fig 1 and Fig 6. Data points are colour coded according to leaf width at the beginning of each time interval, as detailed in legend to Fig 1. (A) Epidermal cells in the lamina. (B) Subepidermal cells in the lamina. (C) Epidermal cells in the midline. (D) Subepidermal cells in the midline. (E-H) Output from epidermal and subepidermal models. (E) v-cells in the lamina of the epidermal model. (F) v-cells in the lamina of the subepidermal model. (G) v-cells in the midline of the epidermal model. (H) v-cells in the midline of the subepidermal model. Model data points are colour coded according to leaf width at equivalent stages to the data. (I-J) Areal growth rates of tracked cells in the lamina (Lam) and midline (Mid) regions, according to whether they were competent to divide or not competent to divide for the (I) epidermis and (J) subepidermis. Data are grouped according to tracking interval (as in Fig 1); colours represent leaf widths at the start of each interval (as for A-D). Boxes represent the central 50% of the data, with top and bottom at the 25% and 75% quantiles of the data. Central red lines represent the median of the data, and two medians are significantly different (at a 5% significance level) if their notches overlap. Outliers are shown as red crosses. Data with a sample size less than 15 are omitted. Source data are available from https://figshare.com/s/b14c8e6cb1fc5135dd87. Lam, lamina; Mid, midline; v-cell, virtual cell.

