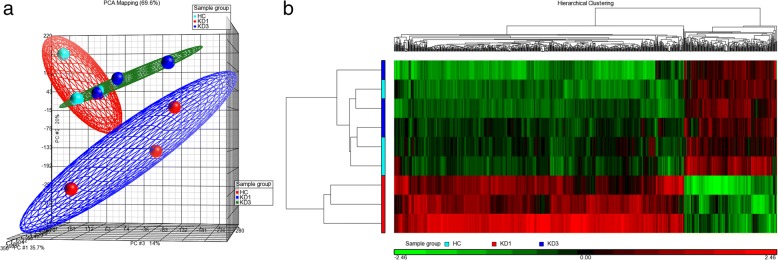
Fig. 3.
Gene expression profiles among the HC, KD1, and KD3 sets. We conducted gene expression microarray (HTA2.0) assays on three pooled HC, three pooled KD1, and three pooled KD3 samples. The generated raw data was analyzed with Partek to produce a a PCA plot and b a heat map. The heat map was plotted with the gene expression profiles of 936 genes

