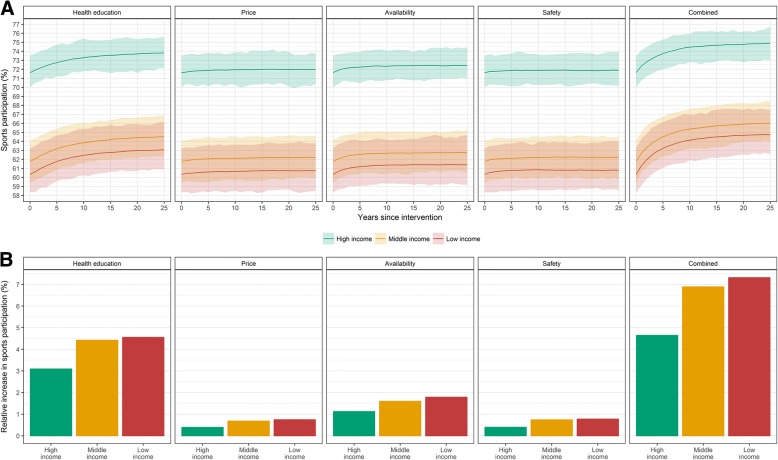
Fig. 3.
Predicted impact of interventions on sports participation rates by income group. a Impact on the proportion of total sports participation by income group over time; b Relative increase in sports participation after 25 years by income group; Interventions scenarios include: 1) providing health education (effectiveness: 1.5x current tendency; reach: 15%), 2) lowering price level of expensive sports facilities to cheap; 3) increasing availability in five neighborhoods; 4) improving safety (target: average perceived safety score); 5) combining all previous interventions. The shaded area represents the 95% uncertainty interval, which reflects parameter uncertainty and stochastic variation

