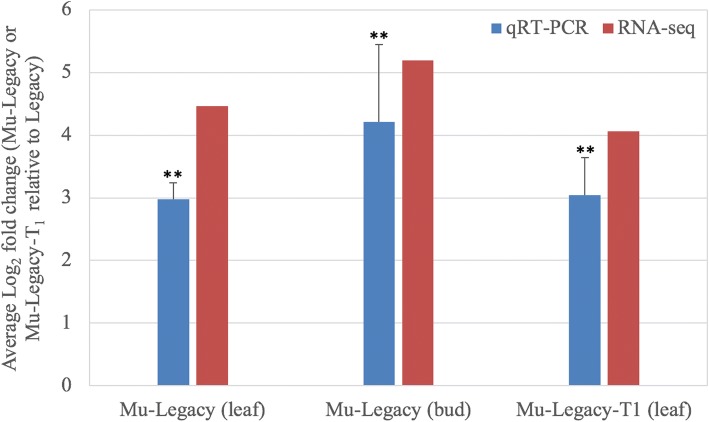
Fig. 9.
qRT-PCR analysis of VcRR2 in Mu-Legacy and Mu-Legacy-T1 using E1F and E1R primers. Eukaryotic translation initiation factor 3 subunit H is the internal control. Log2(fold-change) in Legacy-VcDDF1-OX was calculated by -∆∆Ct = −[(CtGOI – Ctnom)Mu-Legacy or Mu-Legacy-T1 – (CtGOI – Ctnom)Legacy]. Average fold-changes ± standard deviation of three biological replicates for each of Mu-Legacy, Mu-Legacy-T1, and nontransgenic ‘Legacy’ plants were plotted. Significant average fold-change determined using a Student’s t-test is denoted. Asterisks (**) indicate p < 0.01. The fold change of RNA-seq is an average of the Log2Fold change (Mu-Legacy/Legacy) for three DE isoforms listed in Table 1

