Fig. 2.
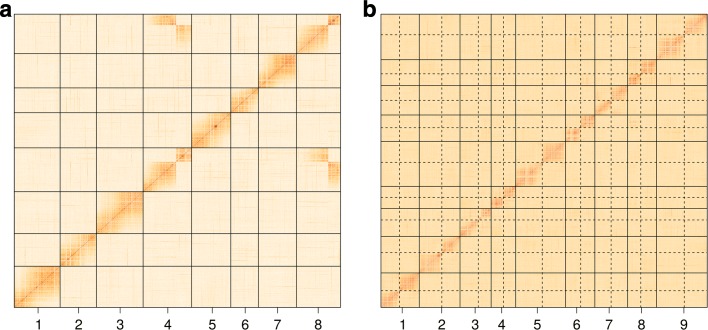
Heatmaps of absolute pairwise correlations between markers from two mapping populations. In the heatmaps, the darker the color, the higher is the correlation between markers. Populations were composed by 389 alfalfa (a) and 129 switchgrass (b) full-sibs. Both species are tetraploids, but switchgrass has been thoroughly diploidized. We classified the markers under a range of ploidy levels (from four to six for alfalfa and from two to four for switchgrass) and selected for the lowest ploidy level (four and two, respectively). See text for additional parameters. Monomorphic and redundant markers were filtered out. Single dosage markers were also excluded to abbreviate the calculations. aMedicago sativa is composed by eight chromosomes, as is the M. truncatula reference genome, here represented by 7,937 markers. Note a major translocation between chromosomes 4 and 8. bPanicum virgatum genome has two sets of nine homoeologous chromosomes each (the pairs are separated by dashed lines). All chromosomes were represented in the heatmap by 16,263 markers

