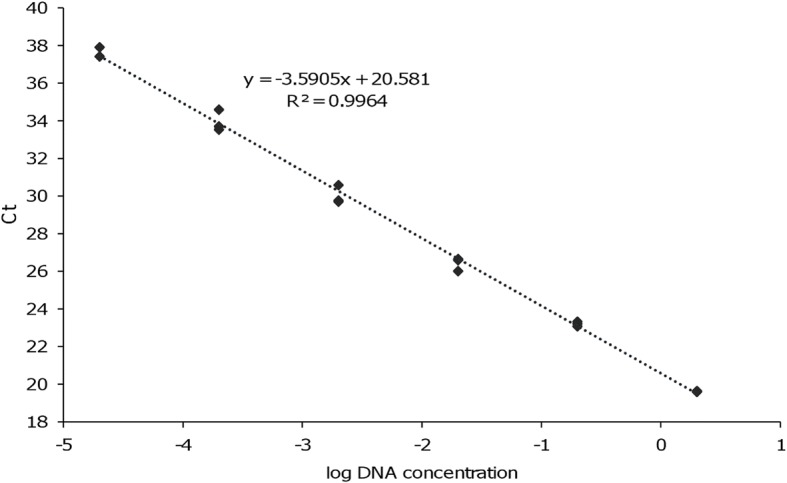
Fig. 2.

Linear correlation between the log of DNA concentration and Ct values. The qPCR-MEint curve was obtained amplifying serial dilutions of genomic DNA (from 2 to 2 × 10⁻⁵ ng/reaction tube) purified from L. infantum MHOM/FR/78/LEM75 (y = -3.59x + 20.58). Each reaction was performed in triplicate. Reaction efficiency = 90%, R2 = 0.996
