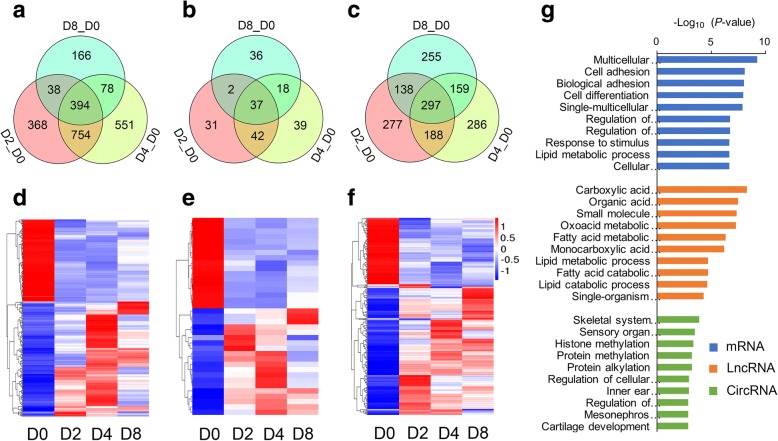
Fig. 5.
Expression analysis of common DE genes during the differentiation process. The number of common DE mRNAs (a), lncRNAs (b), and circRNAs (c). The expression levels of common DE mRNAs (d), lncRNAs (e), and circRNAs (f). (g) GO analysis of common DE genes. The top 10 enriched GO terms ranked by P-values are shown

