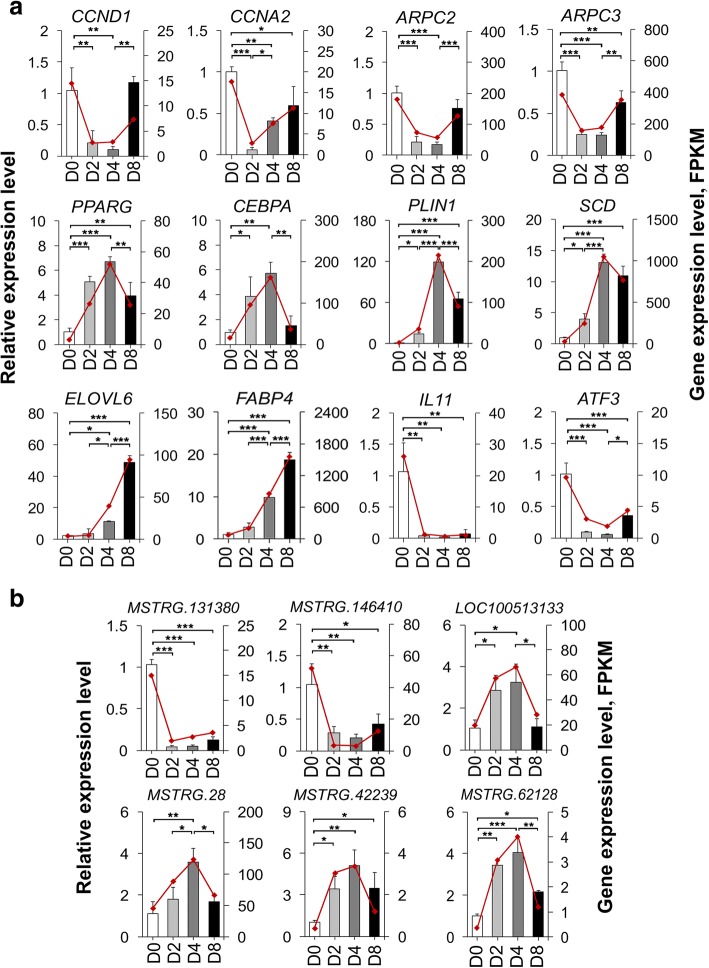
Fig. 7.
Validation of the expression of DE genes by qRT-PCR. qRT-PCR validation of the expression levels of twelve DE mRNAs associated with cell cycle, actin cytoskeleton, cell differentiation, and lipid metabolism process (a) and six randomly selected DE lncRNAs (b) in the four differentiation stages. Data from qRT-PCR are shown as column and Y-axis on the left, while the data from RNA-Seq are shown as line and Y-axis on the right. Data are represented as mean ± SD, n = 3 per group. * P < 0.05; ** P < 0.01; *** P < 0.001

