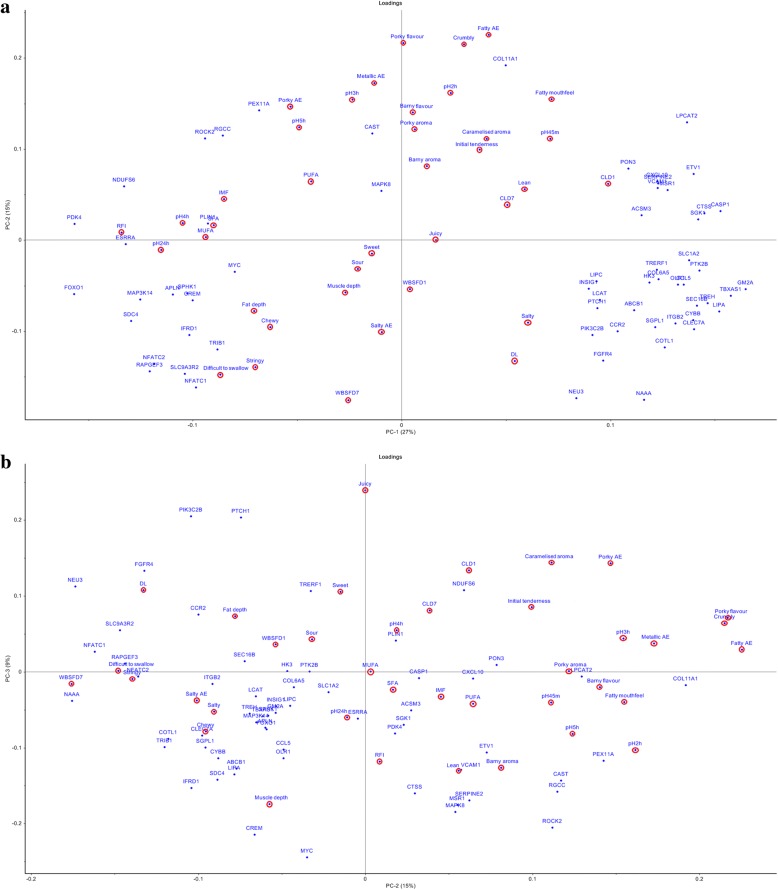
Fig. 6.
Principal component analysis of product quality traits with normalised expression values of selected DE genes, out of the 272, in FE-divergent pigs. PC1 vs PC2 is depicted in biplot (a) and PC2 vs PC3 is depicted in biplot (b). DL: drip loss (%), WBSF D1: Warner Bratzler shear force day 1 pm (N), WBSF D7: Warner Bratzler shear force day 7 pm (N), CL D1: cook loss day 1 pm (%), CL D7: cook loss day 7 pm (%), Fat depth (mm), Muscle depth (mm), Lean (%), IMF: intramuscular fat content (%), SFA: saturated fatty acid (mg), MUFA: monounsaturated fatty acid (mg), PUFA: polyunsaturated fatty acid (mg); AE: after effect; meat sensory attributes were scored from 0 (not detectable) to 100 (extremely detectable)

