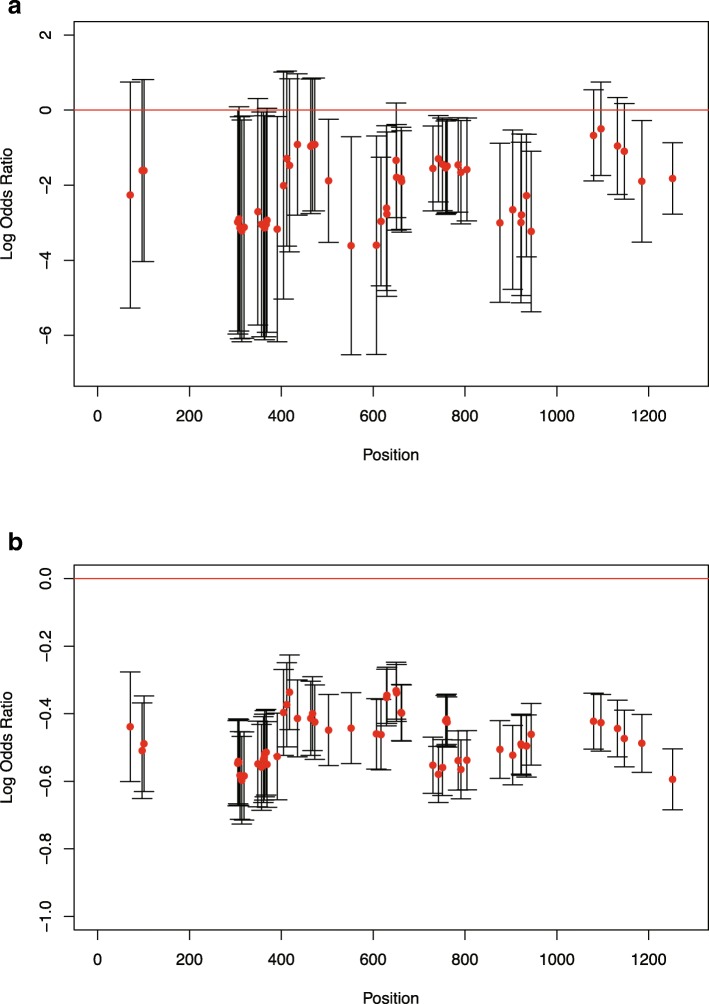
Fig. 4.
The log odds ratios of the depths at heterozygous SNP positions in the HLA-A gene of patient RK069. The log odds ratios were calculated for a the WGS data and b the TruSight HLA Sequencing Panel data. These log odds ratios correspond to the relative quantities of observed A*26:01:01 SNPs in the tumor sample compared with the normal sample. The red dots indicate the mean values of the log odds ratios, and the vertical lines indicate the 95% confidence intervals

