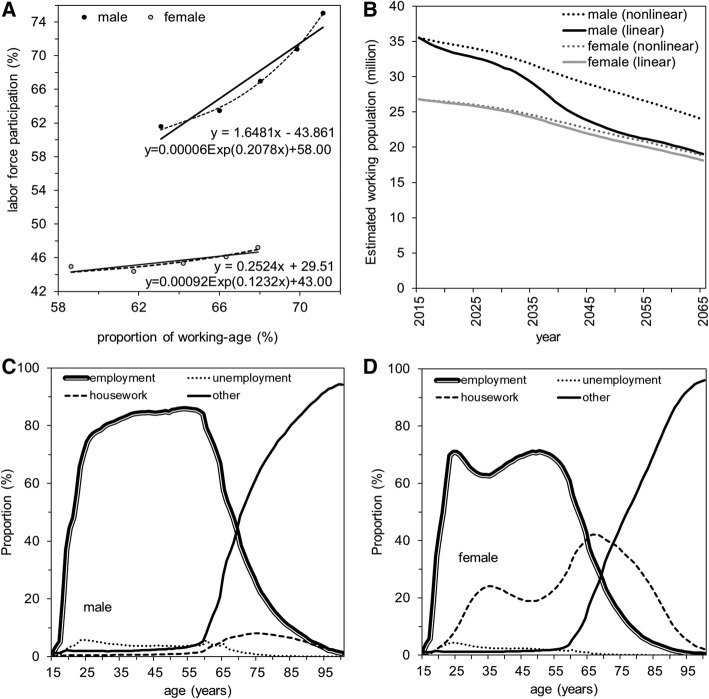
Fig. 3.
Predicted labor force and labor state in Japan. a Linear and nonlinear predictions of labor force participation using the working-age population size from 1995 (upper right for both males and females) and up to 2015 (lower left for both males and females). Best fit models along with expected value equations with estimated parameters are shown inside the panel. b Estimated number of workers based on linear and nonlinear extrapolations of labor force participation from 2015 to 2065. c, d Age-dependent snapshot of the labor state for males and females, respectively, according to the 2015 census

