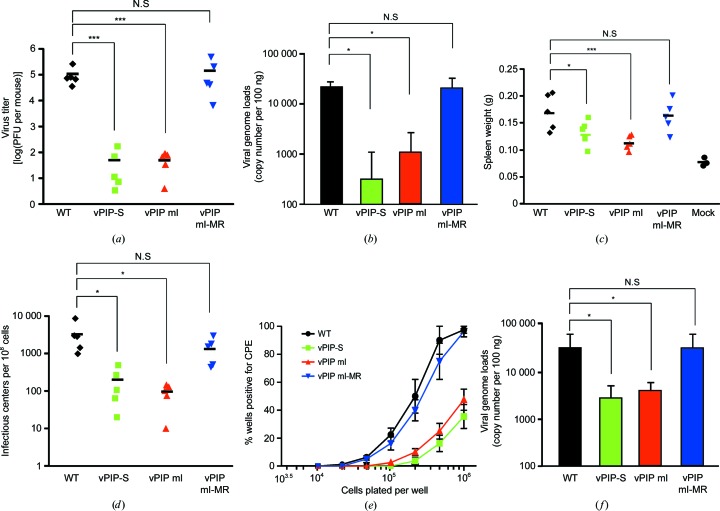
Figure 6.
In vivo acute and latent infections by the mutant virus (vPIP mI). BALB/c mice were intranasally infected with 1000 plaque-forming units of WT, vPIP-S, vPIP mI or vPIP mI-MR virus. (a, b) Acute infection with the vPIP mI mutant in the lungs. At 6 d post-infection the lungs were excised and homogenized to determine lytic viral titers in plaque assays (a). Each symbol represents the viral titer from the lung tissue of individual mice, with the bar showing the mean value (n = 5 in each group). The genomic DNA samples were extracted from the lungs of infected mice. The viral genome copy numbers were quantitated by real-time PCR (b). The average viral genome copy numbers are shown with the standard error of the mean. (c–f) Latent infection with the mutant (vPIP mI) in the spleen. At 17–18 d post-infection, the spleens were excised and their weights were measured (c). The splenocytes were prepared and examined for the frequency of cells reactivating the virus by ex vivo infectious-center assays (d) and a limiting-dilution assay (e). In the limiting-dilution assay, each symbol represents the average percentage of wells positive for cytopathic effects with the standard error of the mean (n = 5 in each group). In infectious-center assays, each symbol represents the viral titer from individual mice, with the bar showing the mean value. The genomic DNA samples were extracted from splenocytes of the infected mice. The viral genome copy numbers were quantitated by real-time PCR (f). The average viral genome copy numbers are shown with standard errors of the mean (n = 5 in each group). Statistical analysis was performed by a two-sided Student’s t-test (* denotes P < 0.05 and *** denotes P < 0.005).

