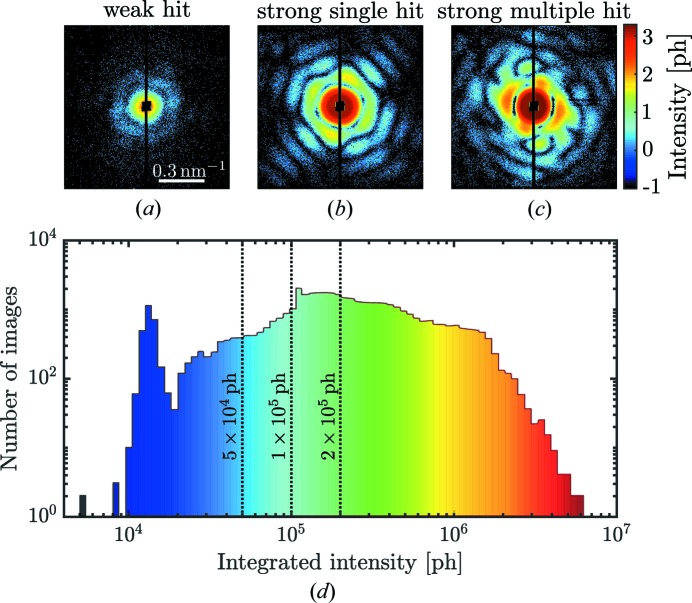
Figure 2.
(a)–(c) Typical diffraction patterns collected during the SPI experiment with (a) typical candidates for weak single hits, (b) strong single hits and (c) multiple hits (all diffraction patterns are shown on a logarithmic scale). (d) Histogram of diffraction images as a function of the integrated intensity. Three dashed threshold lines mark the transient region between weak and strong hits passing our intensity filter. Diffraction patterns in (a) and (c) belong to blue and red regions in (d), respectively. The diffraction pattern in (b) belongs to the central region in (d).

