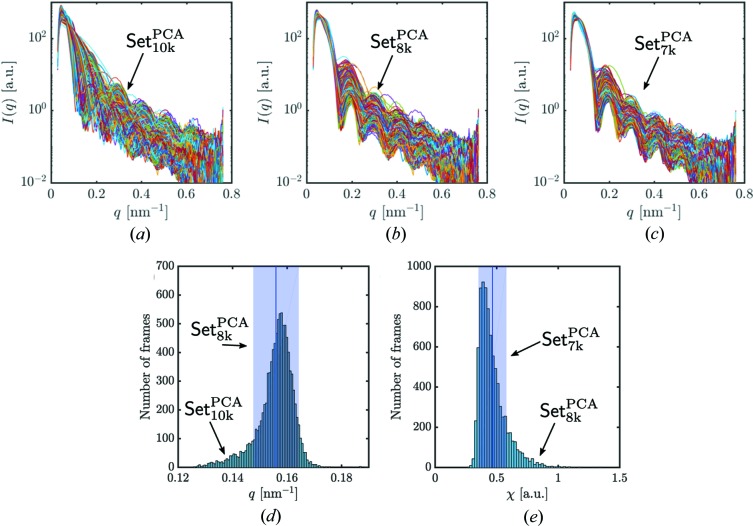
Figure 5.
Power spectral density (PSD) for distinct data sets obtained at different stages of particle-size filtering. (a) PSDs for the data Set10k
PCA of diffraction patterns. (b) PSDs after the size-distribution filtering for Set8k
PCA. (c) PSDs after using a restricted fit quality range for Set7k
PCA. (d) Histogram of positions of the first minimum from data Set10k
PCA used for the size filtering. Diffraction patterns inside the blue box (±1 r.m.s. around the mean value) were selected for further analysis. (e) Histogram of the PSD fit quality χ. Diffraction patterns inside the blue box ( r.m.s. around the mean value) were selected for further analysis.

