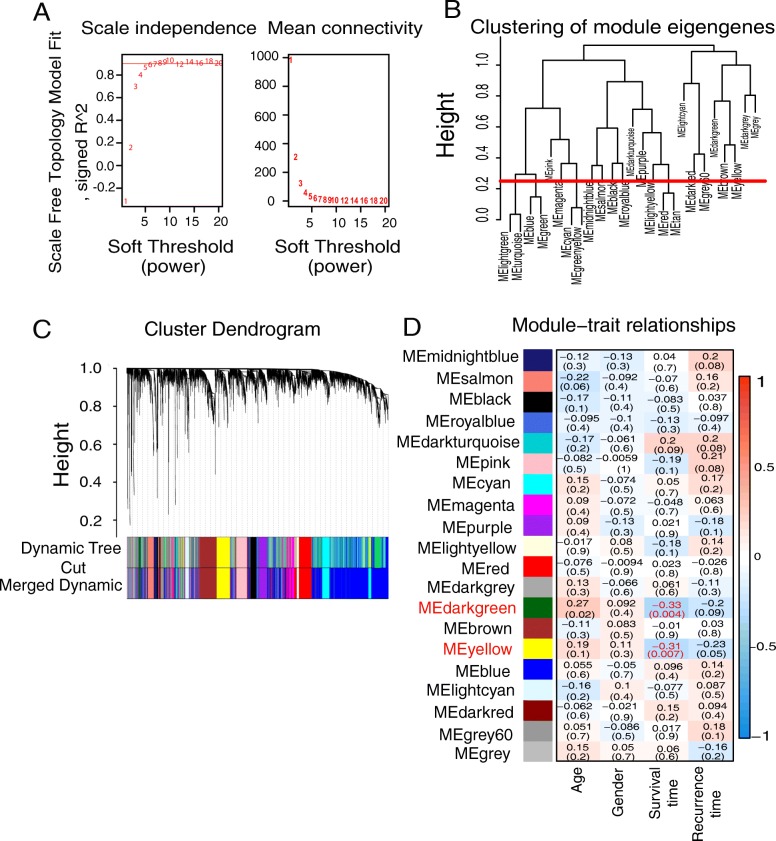
Fig. 1.
Weighted gene co-expression network of glioblastoma. a Identification of the soft threshold according to the standard of the scale-free network. b Dendrogram of consensus module eigengenes. The red line represented merging threshold. Modules with a correlation coefficient greater than 0.75 were merged. c Identification of a co-expression module in glioblastoma. The branches of the cluster dendrogram correspond to the 19 different gene modules. Each piece of the leaves on the cluster dendrogram corresponds to a gene. d Correlation between the gene module and clinical traits. The clinical traits include age, gender, survival time and recurrence time. The correlation coefficient in each cell represented the correlation between the gene module and the clinical traits, which decreased in size from red to blue. The corresponding P value is also annotated

