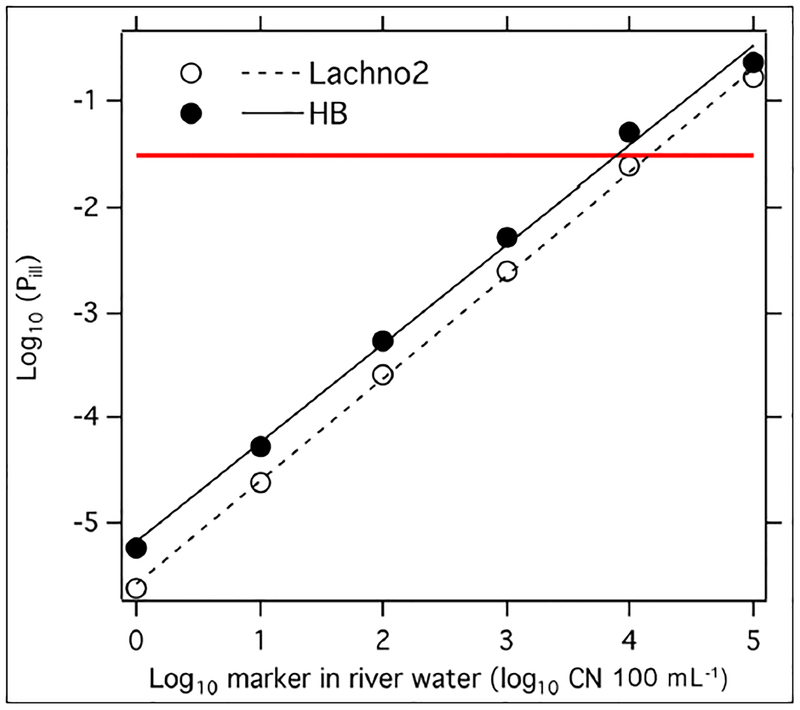
Figure 2: Median illness risk as a function of log10-transformed concentration of HB and Lachno2.
The median probability of illness (Pill) from the simulated Pill distributions for each considered marker concentration is shown as a symbol. A linear least squares approach was used to generate a linear curve fit between log10-transformed median Pill (y) and log10-transformed marker concentration (x). The equations for the lines are for Lachno2: y = 0.976 × −5.579 (R2 = 0.999), and for HB: y = 0.941 × −5.185 (R2 = 0.997). The threshold of 30 per 1,000 illnesses (3%, shown as a red horizontal line) crosses the two curve fit lines at 14,000 copy number (CN) 100 ml−1 water (Lachno2) and 7, 800 CN 100 ml−1 river water (HB). DOI: https://doi.org/10.1525/elementa.301.f2

