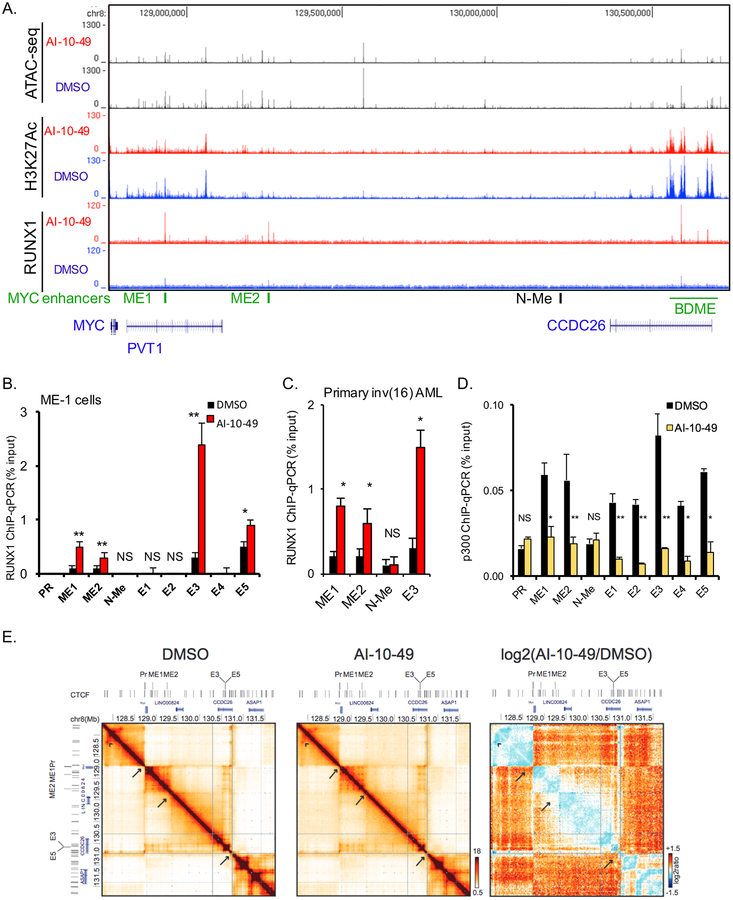
Figure 5. RUNX1 increases association with chromatin at three distal MYC enhancers in inv(16) cells.
(A) Analysis of ATAC-seq and K3K27ac and RUNX1 ChIP-seq profiles in a 2 Mb genomic region downstream of MYC. The three enhancer regions (ME1, ME2 and BDME) are depicted in green. (B-D) ChIP-qPCR analysis for RUNX1 in DMSO or AI-10–49 treated cells (B), in DMSO or AI-10–49 treated human primary CD34+ inv(16) AML cells (C), and for p300 in DMSO or AI-10–49 treated ME1 (D). (E) 5C interaction matrices for the MYC locus (−1Mb to +3Mb) in DMSO (left panel) and AI-10–49 (middle panel) treated ME-1 cells. The right panel shows the log2(AI-10–49/DMSO) ratio of the interaction matrices (blue color scheme: higher interaction frequencies in DMSO treated cells; orange color scheme: higher interaction frequencies in AI-10–49 treated cells). Arrows indicate TAD boundaries, arrowhead points to an example of a CTCF-CTCF looping interaction. Significance was calculated using unpaired t-test, *P < 0.05, or **P < 0.005. See also Figures S5 and S6.

