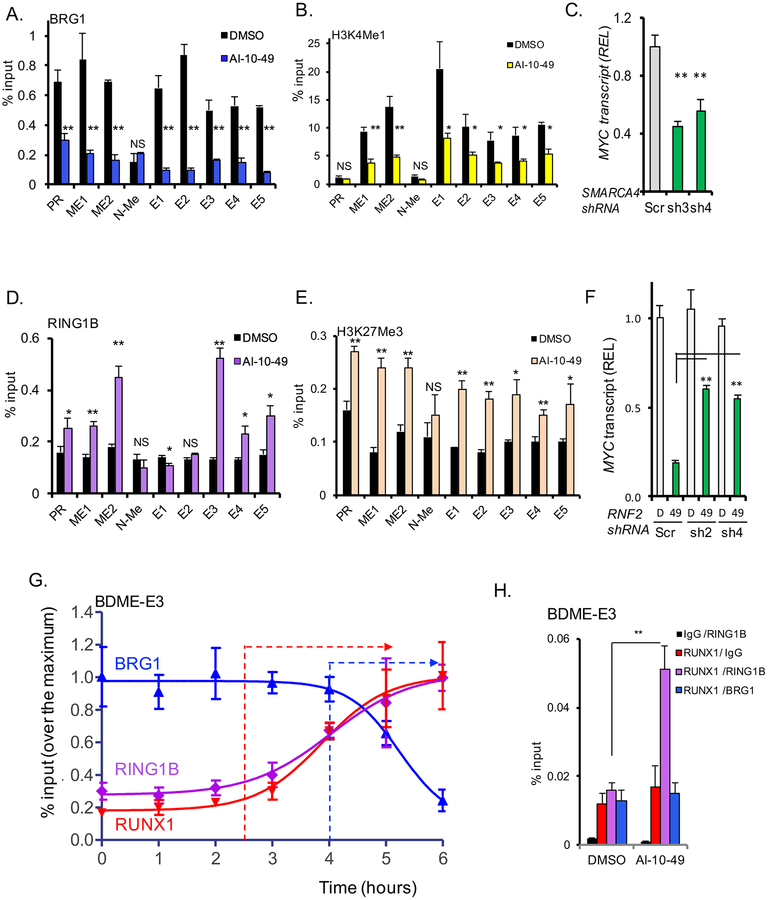
Figure 6. AI-10–49 induces a switch of activation for repressive marks at RUNX1 associated MYC enhancers.
(A-B) ChIP-qPCR analysis of treated ME-1 cells at promoter (PR) and eight MYC enhancers (ME1, ME2, N-Me, and BDME elements E1 to E5) for BRG1 (A) and H3K4me1 (B). (C) MYC transcript level analysis in ME-1 cells transduced with scramble (Scr) or SMARCA4 shRNAs (sh3 and sh4), estimated by qRT-PCR. (D-E) ChIP-qPCR analysis of treated ME-1 cells at MYC promoter and MYC enhancers for RING1B (D), and H3K27Me3 mark (E). (F) MYC transcript level analysis in ME-1 cells transduced with scramble (Scr) or RNF2 shRNAs (sh2 and sh4) and treated with DMSO (D) or AI-10–49 (49), estimated by qRTPCR. (G) Time course ChIP-qPCR analysis of RUNX1, RING1B and BRG1 binding at E3 in treated ME-1. (H) Quantitative ChIP-re-ChIP of treated ME-1 ChIPed for RUNX1 or IgG, and re-ChIPed for IgG (red), RING1B (violet), or BRG1 (blue), at the E3 enhancer. Results from triplicate experiments are shown; error bars represent the SD. Significance was calculated using unpaired t-test; *P < 0.05, or **P < 0.005. See also Figure S7.

