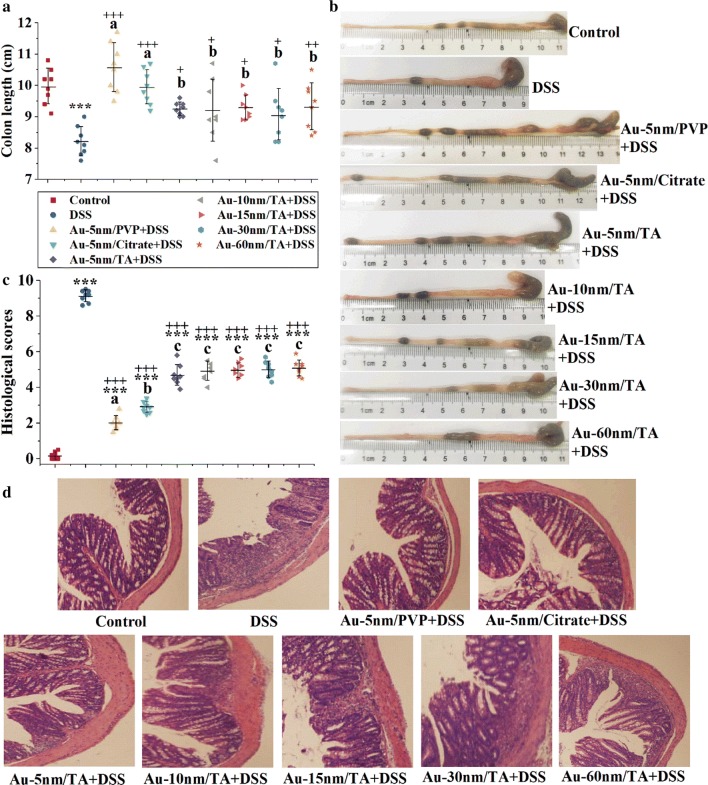
Fig. 2.
Histological observation of the colon: a colon length; b representative images of the measurements of colon length; c histological scores and d typical images of H&E stained colonic sections. Each point in a and c represents a single sample. Asterisks and plus signs represent significant differences (***P < 0.001, +++P < 0.001, ++P < 0.01, +P < 0.05, Dunnett’s post hoc test following ANOVA) versus the normal control and the DSS control, respectively. Different lower-case letters mark significant differences (P < 0.05, ANOVA followed by LSD test) between AuNP-treated groups

