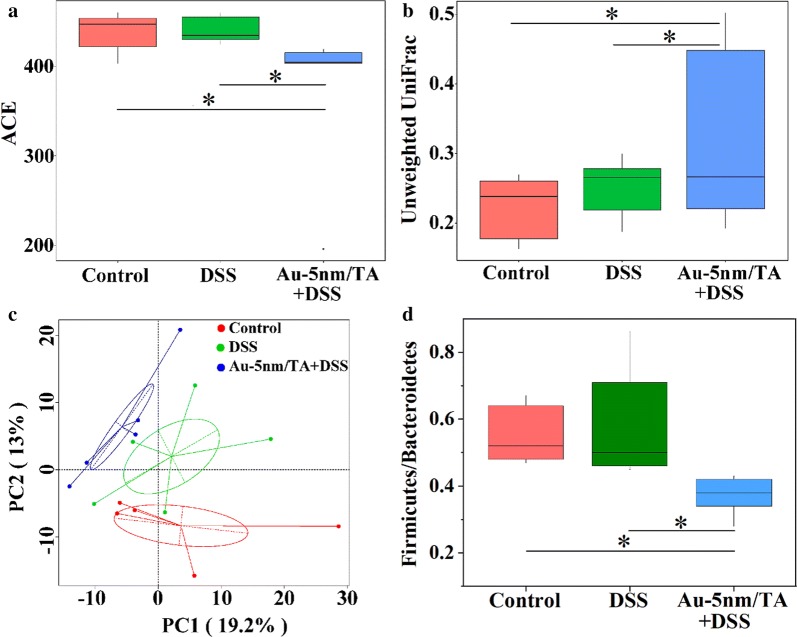
Fig. 4.
The effects of orally administered AuNPs on global gut microbiota structures: a the α-diversity metric ACE; b the unweighted UniFrac metric; c PCA analysis of β-diversity based upon the unweighted UniFrac distances, where each point represents a single sample with the percentages indicating the contribution of principal components to the difference of samples; d the ratios of Firmicutes to Bacteroidetes. The comparison is made by Wilcox’s test, and significant P-value is marked as *P < 0.05

