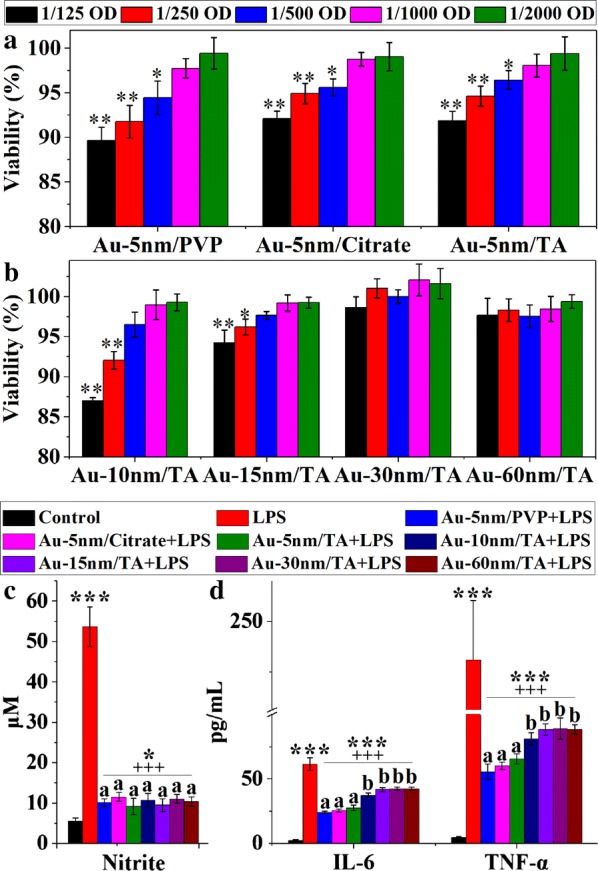
Fig. 6.

The biological effects of AuNPs on RAW264.7 cells: a, b cell viability measured by MTT assay (n = 6), with significance tested by one-way ANOVA with Dunnett’s post hoc test (*P < 0.05 and **P < 0.01, versus the control); c, d production of NO (n = 6), IL-6 (n = 3) and TNF-α (n = 3) following LPS activation, with asterisks and plus signs representing significant differences (***P < 0.001, *P < 0.05, +++P < 0.001, Dunnett’s post hoc test following ANOVA) versus the normal control and the LPS control, respectively, and different lower-case letters marking significant differences (P < 0.05, ANOVA followed by LSD test) between AuNP-treated groups
